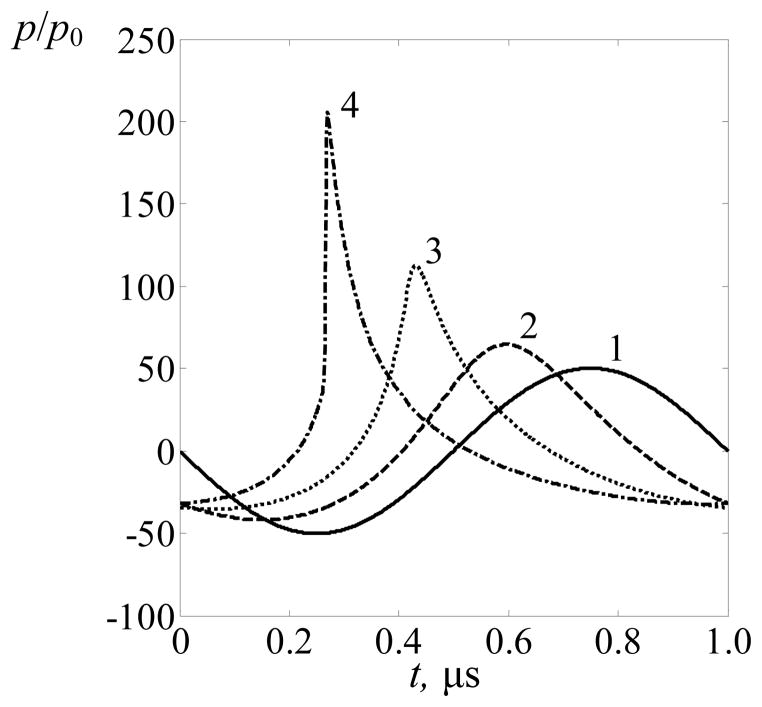
Figure 3.
Comparison of one cycle of the focal waveforms in a linear beam (solid curve 1) and in nonlinear beams simulated in a free field in water at I0 = 1 W·cm−2 (curve 2), I0 = 5 W·cm−2 (curve 3), and I0 = 10 W·cm−2 (curve 4), where I0 is the intensity at the array elements. All the elements of the array are switched on and no ribs are present at the beam path. The waveforms are normalized to the characteristic initial pressure amplitude p0 at the face of each element and are artificially shifted by 0.15 μs relative to each other for better separation.

