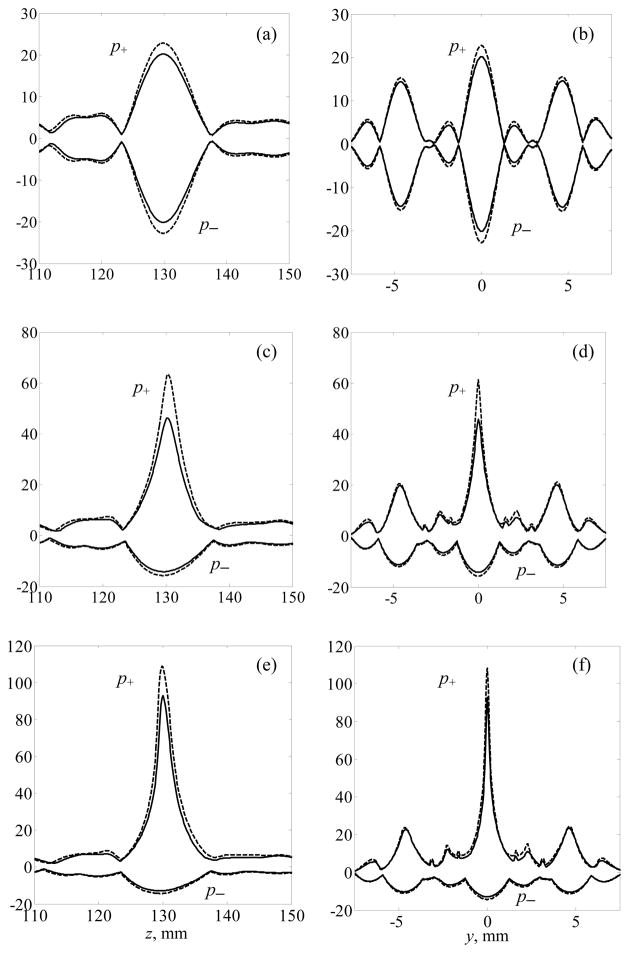
Figure 8.
Peak positive and peak negative pressure distributions along the z-axis (left column) and in the focal plane (right column) along the y-axis (x = 0) when all the elements of the array are active (dashed lines) and when some elements are switched off (solid lines). The distributions are calculated using the linear approximation (a, b) and accounting for nonlinear effects at I0 = 20 W·cm−2 (c, d) and I0 = 40 W·cm−2 (e, f). I0 is the intensity at the operating array element front face. The distributions are normalized by the initial pressure amplitude p0 = ρ0c0V0.

