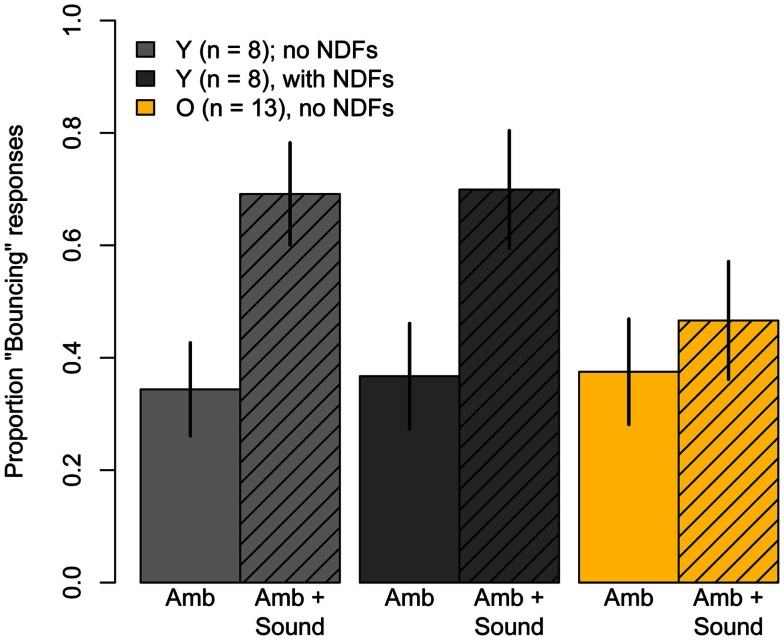
Figure 6.
Mean Pr(“Bouncing”) responses produced in the ambiguous conditions of Experiment Two: Ambiguous motion and Ambiguous motion accompanied by the sound used in Experiment One. Light gray bars represent data for eight younger subjects when they viewed the stimuli normally, without neutral density filters, and the dark gray bars represent results obtained when subjects viewed the stimuli through three neutral density filters. Yellow bars represent data of 13 older subjects who participated in Experiment One and were retested in these conditions without neutral density filters. Error bars are ±1 standard error of the mean.

