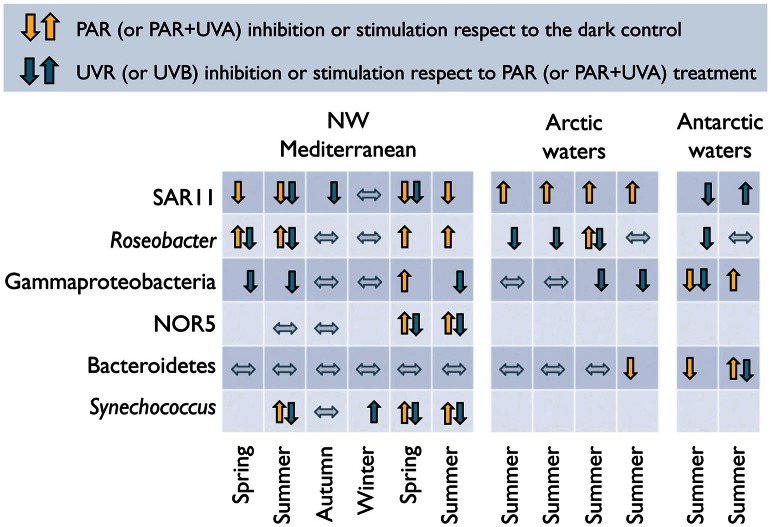
Figure 4.
Diverse responses to sunlight spectrum conditions among different bacterial groups. Light-driven effects on the percentage of cells active in 3H-leucine uptake among different bacterial groups as determined by MAR-CARD-FISH in natural samples. Up- and down arrows indicate significant increase or decrease in the proportion of active cells, respectively, caused by PAR (or PAR + UVA in the case of polar samples, yellow arrows) or full sunlight exposure (or UVB in the case of polar samples, blue arrows). Mediterranean data from Alonso-Sáez et al. (2006) and Ruiz-González et al. (2012f); Arctic and Antarctic values from Ruiz-González et al. (2012a).

