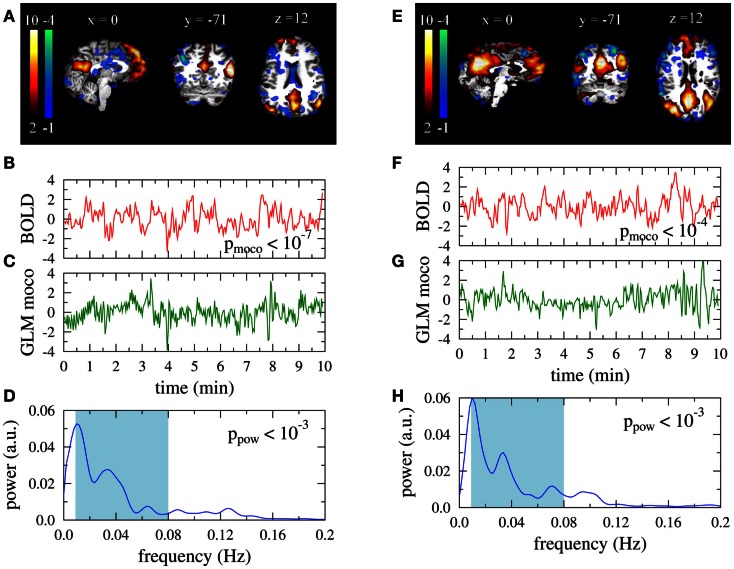
Figure 1.
Default mode networks for two subjects. Left: 37 year old male, right: 35 year old female participant. (A,E) Activation maps. Colorbars represent z-scores of IC weights per voxel. Data are presented in native space. (B,F) Associated BOLD time courses (normalized to zero mean and unit variance). (C,G) Best fit of a GLM with motion correction parameters as regressors to the BOLD data. (D,H) Power spectra of the BOLD time courses.

