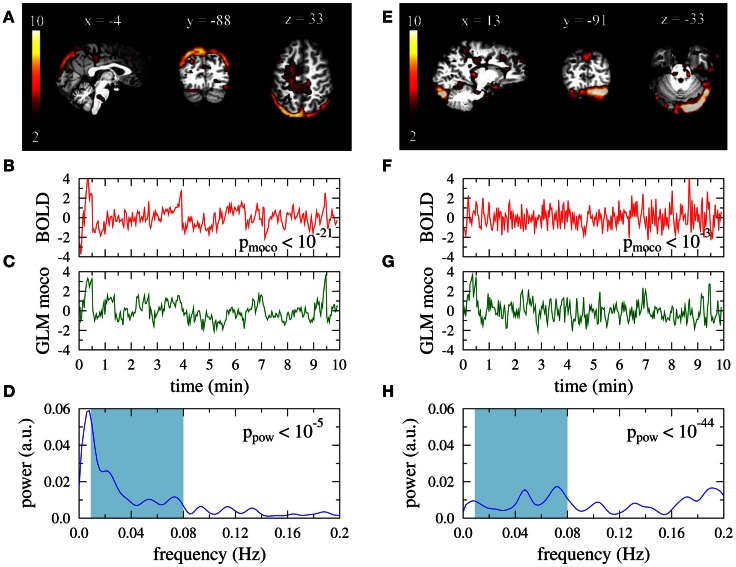
Figure 2.
Artifact related single-subject ICs that are excluded by the automatic filter. Data is taken from a 35-year old female participant. Right: typical type I artifact (residual subject motion), left: typical type II artifact (too much power in high frequencies). (A,E) Activation maps. Colorbars represent z-scores of IC weights per voxel. Data are presented in native space. (B,F) Associated BOLD time courses (normalized to zero mean and unit variance). (C,G) Best fit of a GLM with motion correction parameters as regressors to the BOLD data. (D,H) Power spectra of the BOLD time courses.

