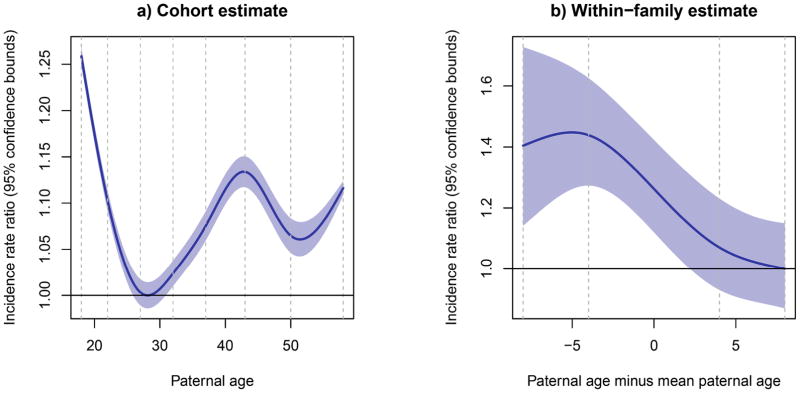
Appendix Figure 2.

Analyses for the number of non-violent crimes committed (truncated Poisson outcome). a) Fitted natural spline from the cohort analysis (GLM) with 95% confidence bounds with paternal age as exposure values. b) Spline for the within-family effect (GEE) with 95% confidence bounds based on the robust variance estimation. The exposure is deviation of paternal age from mean paternal age within family. Results are transformed to rates and divided by the lowest value in the age-span (2.54 for cohort and 1.54 for within family). The vertical dashed lines are the knots in the splines.
