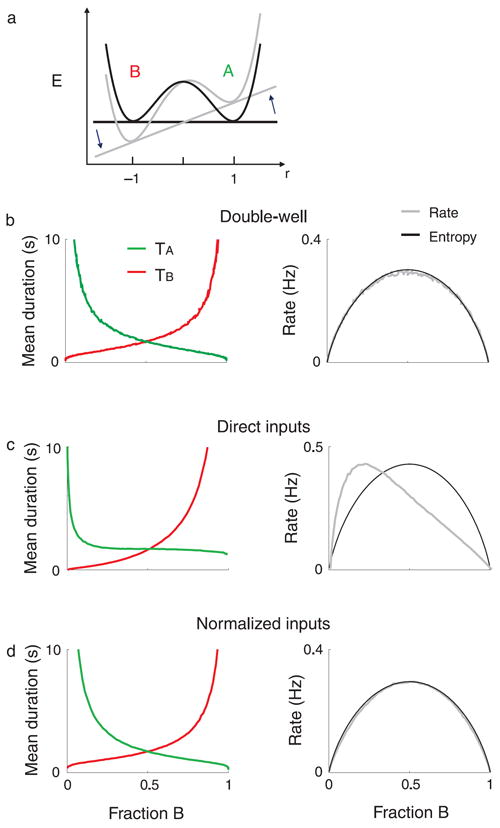
Figure 9.

Models with gain normalization reproduce experimental results. Simulation results of double-well (a, b) and direct cross-inhibition neuronal competition models with direct (c) and normalized inputs (d). The mean dominance durations for the two percepts and the alternation rates as a function of the fraction of dominance of percept B are shown in the left and right panels, respectively. The entropy as defined in Figure 8 is plotted as a function of f for each condition (black lines). The figures were obtained by varying the strengths of the percepts (input currents I; see Methods section), which led to changes of both the fractions of dominance and the mean dominance durations.
