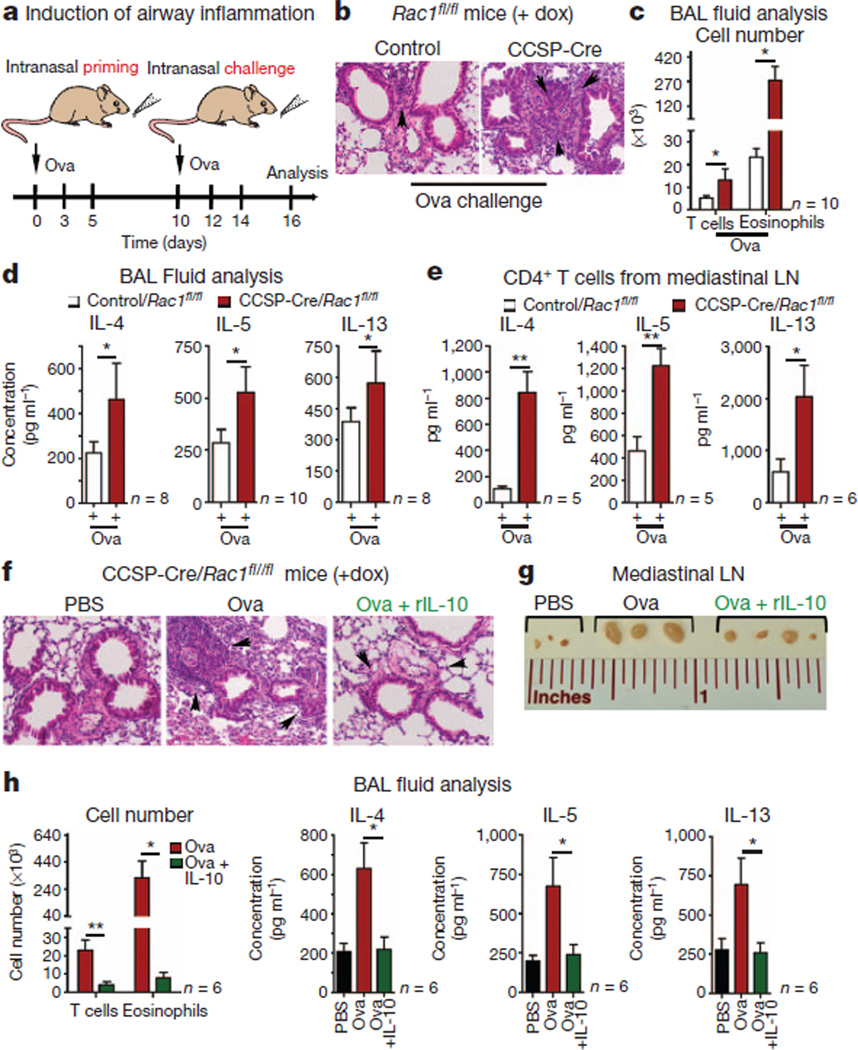
Figure 4. Airway inflammation with Ova after Rac1 deletion.
a, Schematic of intranasal priming and challenge with Ova. b, H&E staining of lung sections from Dox-treated control and CCSP-Cre/Rac1fl/fl mice (×20 magnification). c, Infiltrating CD4+ T cells and eosinophils in BAL fluid of indicated mice. d, Th2-cytokines in the BAL fluid. (c, d, n = 10 mice per group). e, Cytokine production by mediastinal lymph node T cells re-stimulated in vitro for 5 days with Ova (n = 6 mice per group). (c–e, Representative of three experiments). f–h, Rac1-deficient mice primed and challenged with Ova with IL-10. f, H&E staining of lung sections. Arrowheads indicate leukocyte infiltration (×20 magnification). g, Image of mediastinal lymph nodes (f, g, representative of three experiments). h, BAL fluid analysis of infiltrating T-cells, eosinophils and Th2 cytokines (n = 6 mice combined from two experiments). *P < 0.05, **P < 0.01, unpaired Student’s t-test with Welch’s correction.

