
Table 3.
Cellular constituents of hepatic granulomas of the different studied groups
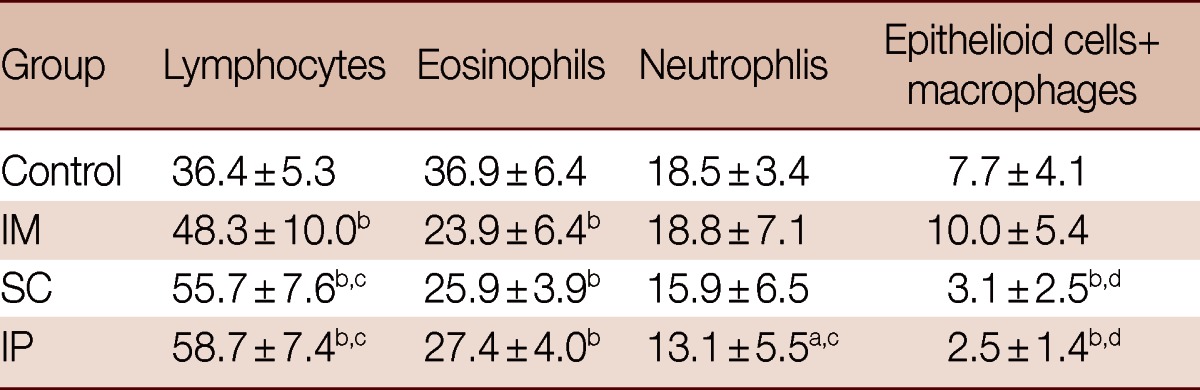
Data are expressed as mean±SD.
aP<0.05; bP<0.01 relative to control group; cP<0.05; dP<0.01 relative to IM group.
Official websites use .gov
A
.gov website belongs to an official
government organization in the United States.
Secure .gov websites use HTTPS
A lock (
) or https:// means you've safely
connected to the .gov website. Share sensitive
information only on official, secure websites.
Cellular constituents of hepatic granulomas of the different studied groups
Data are expressed as mean±SD.
aP<0.05; bP<0.01 relative to control group; cP<0.05; dP<0.01 relative to IM group.