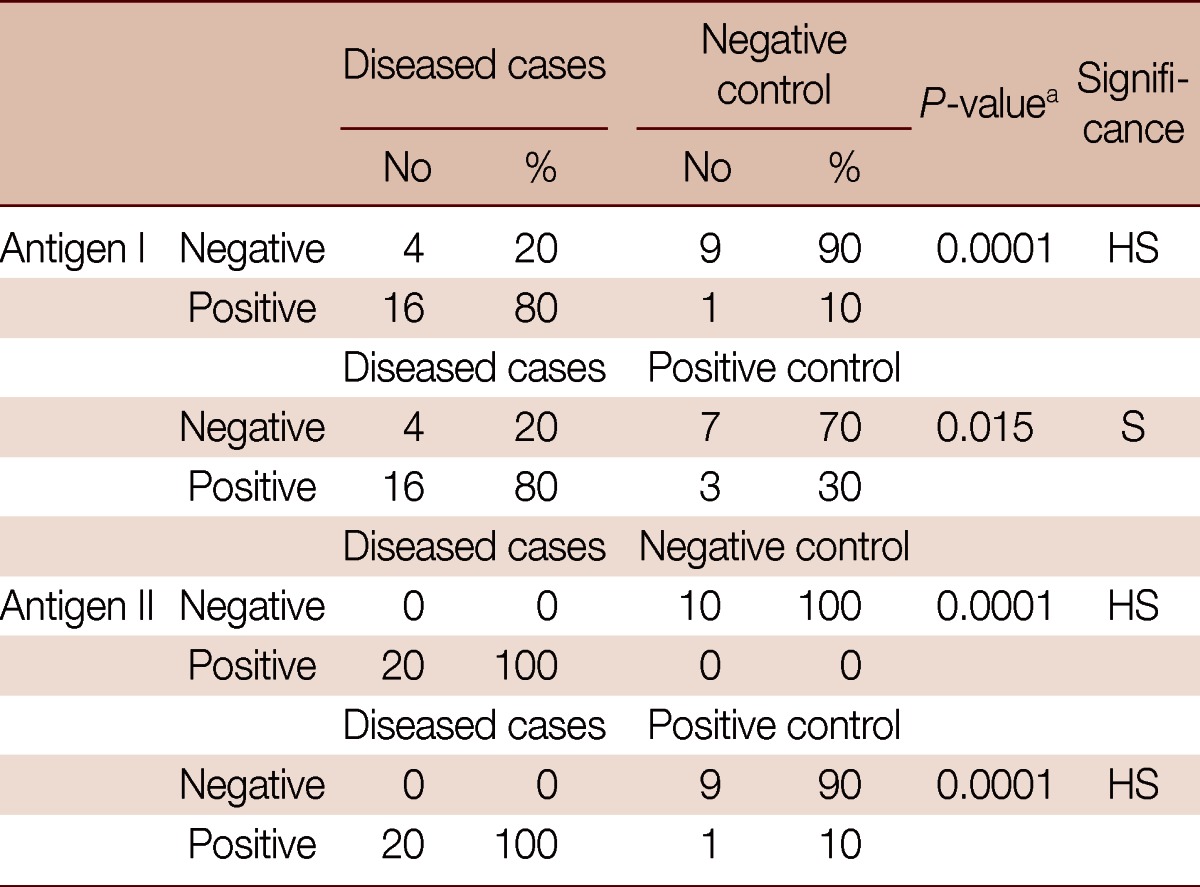
Table 2.
Comparison of diseased cases to positive and to negative controls using antigen I and antigen II by dot-blot assay

The comparison between diseased cases and negative controls for antigen I revealed 94.1% PPV (positive predictive value) and 69.2% NPV (negative predictive value). The comparison between diseased cases and negative controls for antigen II revealed 100% PPV and 100% NPV. The comparison between diseased cases and positive controls for antigen I revealed 84.2% (16/19) PPV and 63.6% (7/11) NPV. The comparison between diseased cases and positive controls for antigen II revealed 95.2% (20/21) PPV and 100% (9/9) NPV.
aFisher's exact test.
