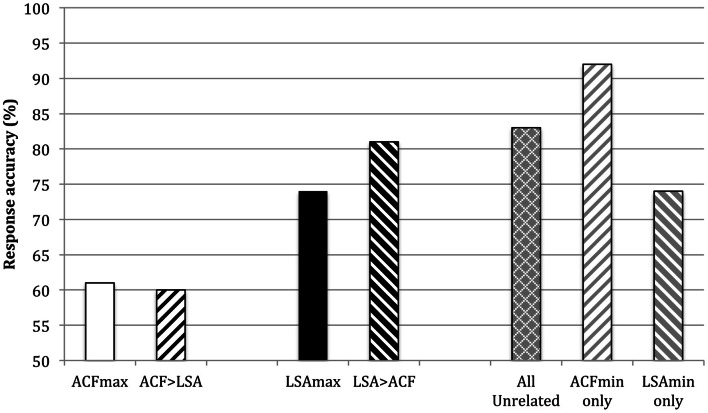
Figure 6.
Percentage correct responses in each of the following conditions: ACF maximum relatedness (ACFmax), ACF more related than LSA (ACF > LSA), LSA maximum relatedness (LSAmax), LSA more related than ACF (LSA > ACF), and semantically unrelated (data shown for both All unrelated, and separately for ACFmin and LSA min items).

