
Figure 2.
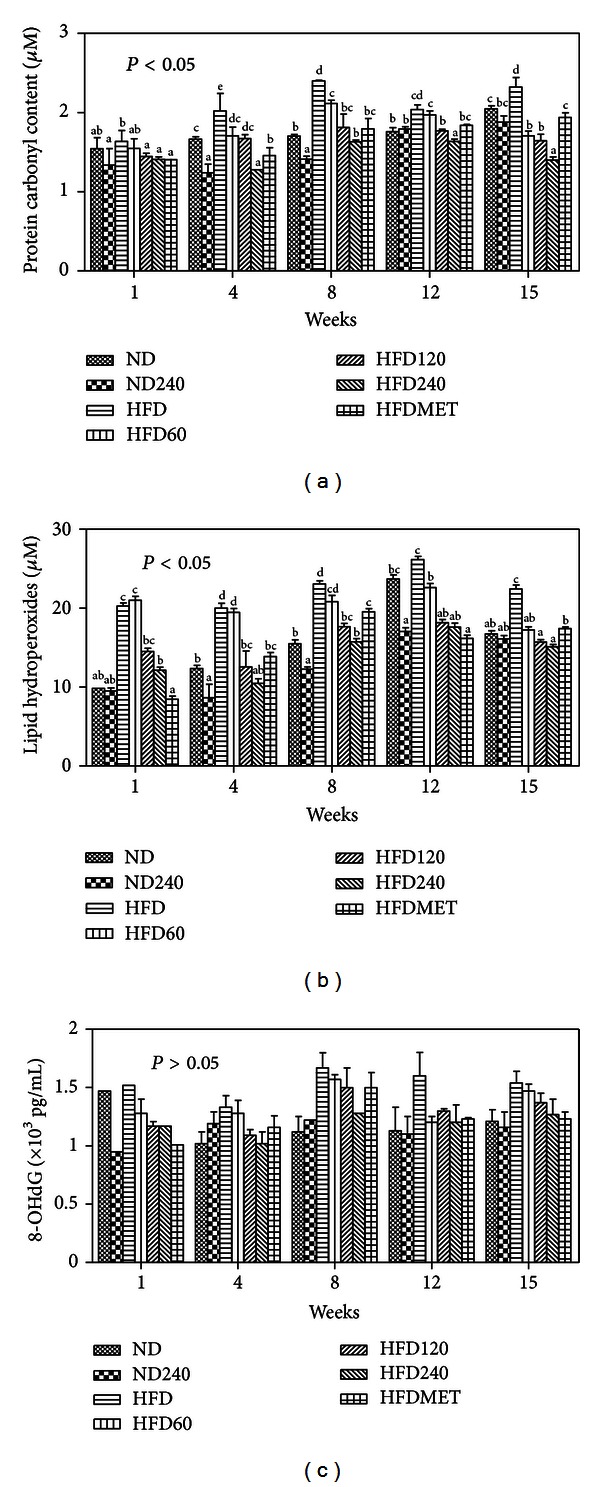
Effects of GE and metformin on (a) AOPP (b) lipid hydroperoxide, and (c) 8-OHdG levels in urine samples of C57BL/6J mice fed on a high-fat diet or normal diet. Values expressed are means ± S.D of triplicate measurements (n = 6 per group). For same assay with various treatment groups, superscripts in the different bar with different alphabets (a)–(e) were significantly different (P < 0.05). Superscripts with same alphabets were not significantly different between the treated groups (P > 0.05). There was no significant difference observed in the 8-OHdG levels between the groups tested (P > 0.05).