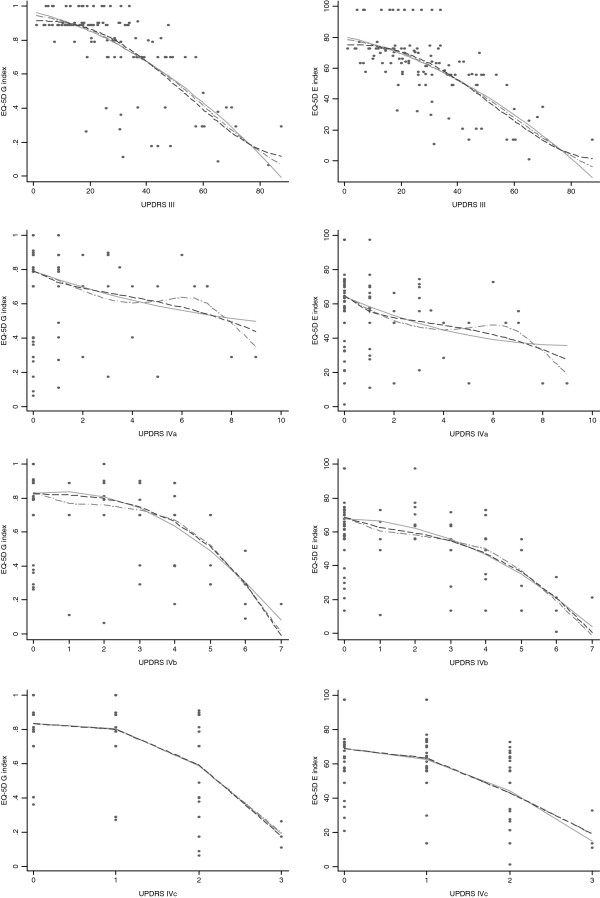
Figure 1.
Presentation of the EQ-5D data fit for the regression line (left panel: EQ-5D German index ; right panel: EQ-5D European index ): comparison of the fitted values estimated by alternative analytic approaches (dots: EQ-5D values; solid line: fitted regression line by ordinary linear regression; dash-dot line: fitted regression line by a generalised additive model; dashed line: fitted regression line by fractional polynomials). The UPDRS II was not presented because its categorical nature led to the accumulation of points by a small number of values.

