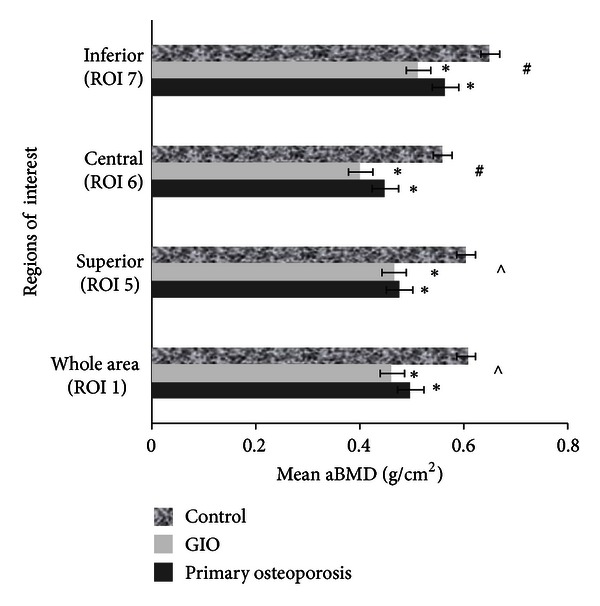
Figure 3.

ANOVA 2, mean areal BMD for transverse regions of interest between groups, adjusted for ROI 1 area. Error bars are SEM. *Significantly different to controls (P < 0.0001). #Significantly different compared to all other ROIs. ∧Significantly different to ROIs 6 and 7.
