
Figure 3.
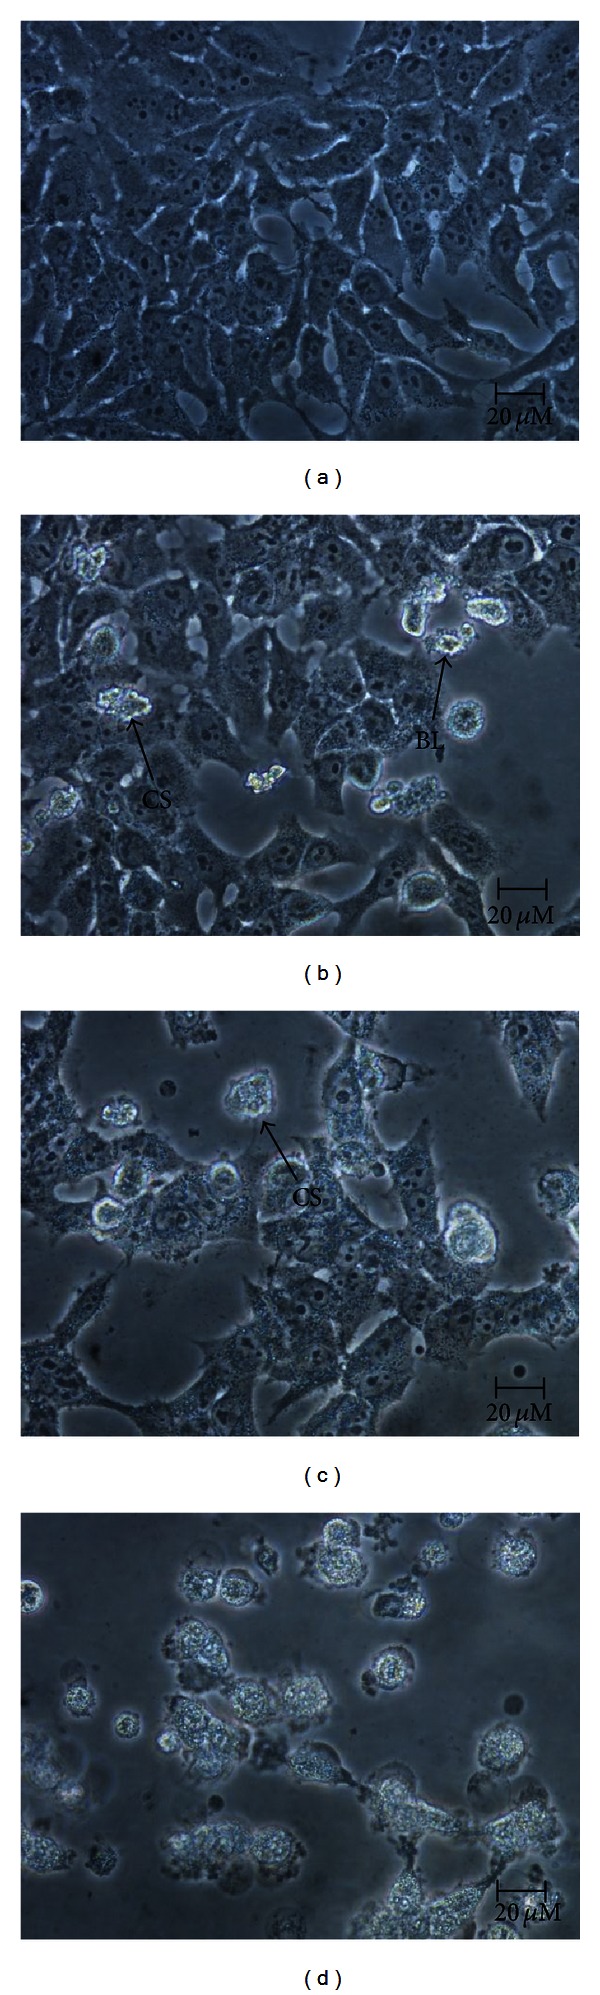
Normal phase contrast inverted micrographs of HepG2 cells treated with 11.43 μg/mL ZER-HPβCD inclusion complex. (400x magnification) (a) Control untreated cells; (b) 24 h treatment (most of the cells having normal morphology with few cells showing membrane blebbing); (c) 48 h treatment (detachment of cells, prominent growth inhibition and membrane blebbing showing apoptogenic morphology); (d) 72 h treatment (most of the cells were detached with obvious cell shrinkage). CS: cell shrinkage; BL: cell membrane blebbing.