
Figure 6.
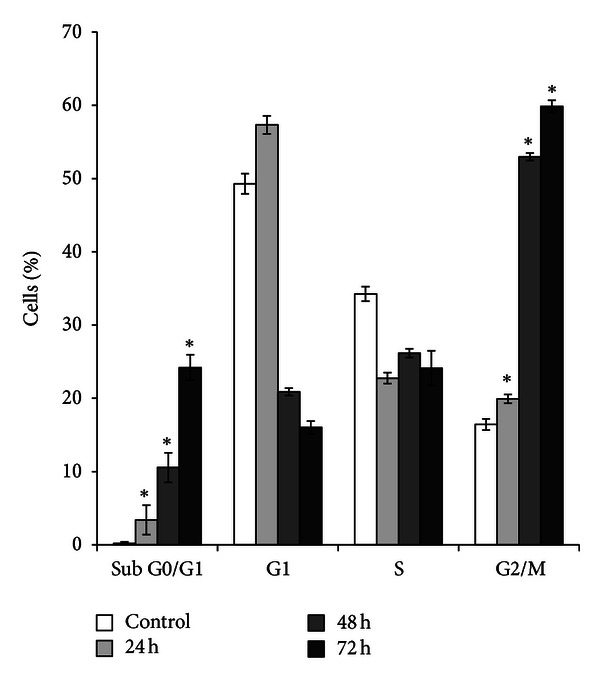
Percentages of cell cycle distribution in sub-G0/G1 (apoptosis cells), G0/G1, S, and G2/M phase of HepG2 cells treated with 11.43 μg/mL of ZER-HPβCD inclusion complex for 24, 48, and 72 h. Induction of G2/M arrest in cell cycle progression of HepG2 cells by ZER-HPβCD inclusion complex. *Indicates a significant difference (P < 0.05) compared with control.