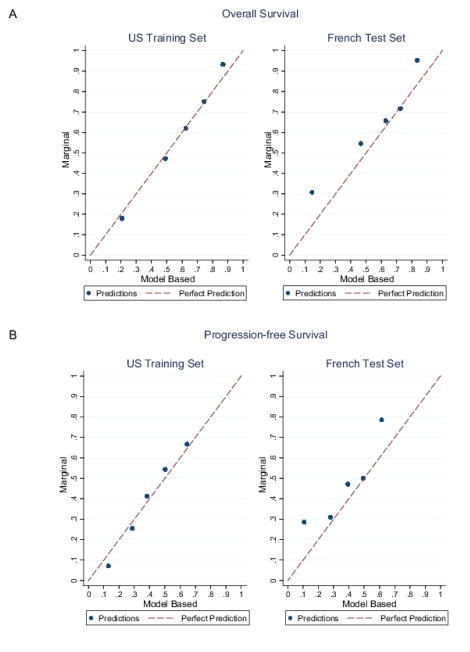
Figure 4. Calibration plots.
Calibration plots of (A) OS at 2 years and (B) PFS at 1 year in both cohorts. Cox predictions were averaged at 2 years within the quintiles of the ordered predictions. Within each quintile, the unadjusted probability of death using Kaplan-Meier survival estimators was estimated. We then plotted unadjusted versus model average predictions. The red line corresponds to the perfect prediction.

