Figure 2.
Stathmin expression is necessary for survival of p53MUT HG-EOC cells following DNA damage, in vitro and in vivo
Source data is available for this figure in the Supporting Information.
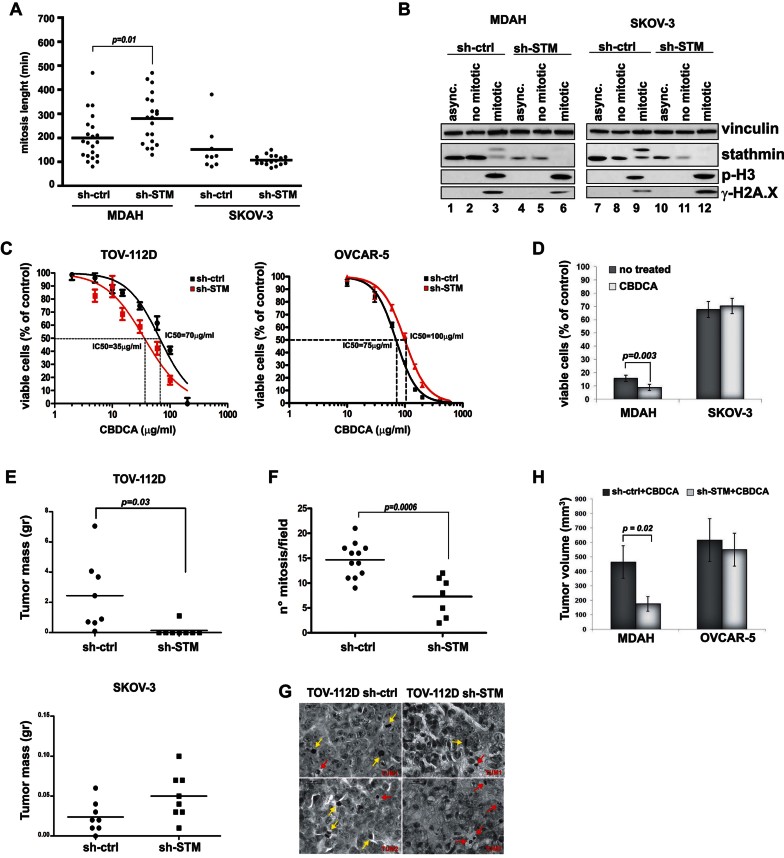
A. M phase length in MDAH and SKOV-3 cells transduced with STM- or ctrl-shRNAs and analysed by time lapse video microscopy. In the scattered dot plot (n = 20 mitosis, in each condition) the median value of mitosis lenght (black bar) is reported.
B. Western blot analyses of EOC cells harvested by mitotic shake off probed for stathmin, p-Histone H3 (p-H3) and p-Histone H2.X (γH2A.X) expression. Stathmin phosphorylation (higher MW band) and p-H3 confirmed that shaken-off cells were in M phase (lanes 3, 6, 9, 12).
C. Evaluation of IC50 in the indicated cell lines treated with increasing doses of CBDCA, in the presence or not of stathmin shRNA. Curves were fitted by nonlinear regression using GraphPad Prism. Results represent the mean (±SD) of three independent experiments performed in quadruplicate.
D. Cell survival of stathmin silenced mitotic cells treated or not with CBDCA for 2 h. Results are expressed as percentage of viable cells respect to controls and represent mean ± SD of four independent experiments performed in quadruplicate.
E. Subcutaneous growth of TOV-112D (upper panel) and SKOV-3 (lower panel) cells stably transduced with control (sh-ctrl) or stathmin (sh-STM) shRNAs. Results are expressed as scattered dot plot (n = 8) with median (black bar) tumour weight.
F. Mitotic index of tumours formed by TOV-112D cells described in E. Data are expressed as number of mitoses/field (40× objective) in at least seven randomly selected fields.
G. Representative H&E staining of tissue sections described in F and collected using a 100× objective (Bar = 20 µm). Yellow arrows indicate normal or aberrant mitosis, red arrows indicate condensed and fragmented nuclei resembling mitotic catastrophes figures.
H. Growth of MDAH and OVCAR-5 xenografts in nude mice treated with intratumoural injection of control (sh-ctrl) or stathmin (sh-STM) sh-RNAs and with intraperitoneal treatment of CBDCA. Results represent the mean (±SD) volume of explanted tumours (n = 5). p values were calculated using t-test using or Mann–Whitney test. Statistically significant differences are reported in each panel.

