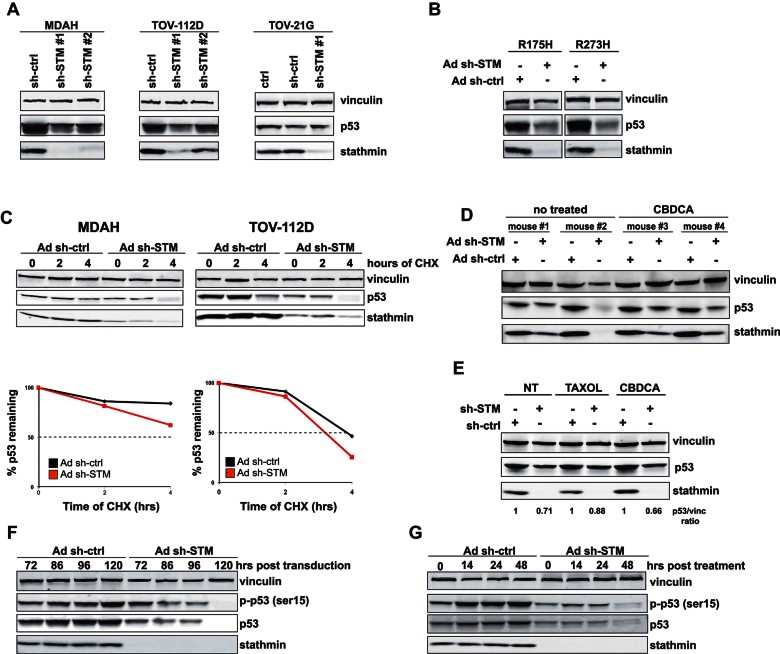
Figure 3.
Stathmin knockdown controls p53MUT stability.
Source data is available for this figure in the Supporting Information.
A. Western blot analysis of p53 and stathmin expression in MDAH, TOV-112D and TOV-21G cells, transduced or not with stathmin shRNAs.
B. Western blot analysis of stathmin and p53 expression in SKOV-3 cells expressing p53R175H or p53R273H mutants, transduced or not with stathmin shRNA.
C. Western blot analysis of p53 and stathmin expression in MDAH and TOV-112D cells transduced with Ad sh-ctrl or Ad sh-STM and treated with 10 µg/ml CHX for 2 or 4 h, as indicated. Densitometric analysis of p53 expression (normalized respect to vinculin expression) is reported in the bottom graphs.
D. Western blot analysis of p53 and stathmin expression in MDAH xenograft tumours after transduction with control (Ad sh-ctrl) or stathmin shRNAs (Ad sh-STM) and treated or not with CBDCA.
E. Western blot analysis of p53 and stathmin expression in MDAH cells transduced with sh-ctrl or sh-STM and treated with TAXOL or CBDCA, as indicated. Densitometric analysis of normalized p53 expression is reported.
F,G. Time course analysis of p53 and pS15-p53 protein expression in MDAH cells after stathmin knockdown (F) and after CBDCA treatment (G). Vinculin was used as loading control in all Western blots.

