Figure 4.
SRSF9 is a proto-oncogene.
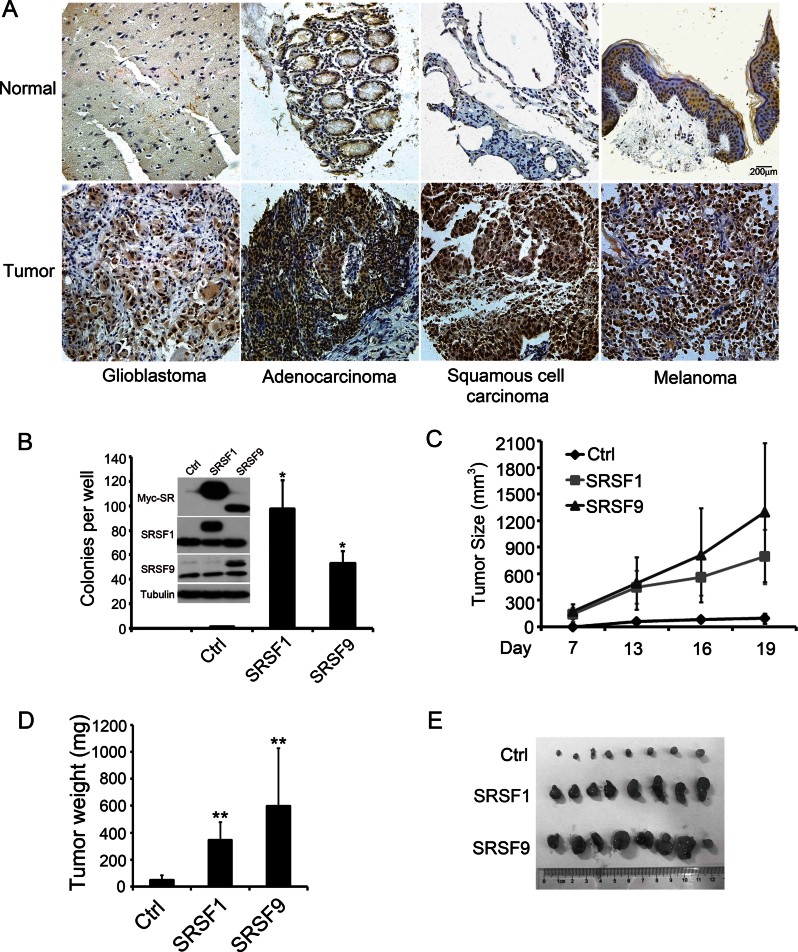
A. Representative immunohistochemical images of SRSF9 expression in human cancer samples (lower panels) and paracancerous normal tissue (upper panels). Scale bar, 200 µm.
B. Quantification of colony formation assay results with control NIH3T3 cells or cells stably expressing SRSF1 or SRSF9. The expression levels were shown in inset. p Values in pairwise comparisons to the control group, *p < 0.05. (mean ± SD, n = 3)
C–E. Tumour volumes were evaluated in mice injected with 2.5 × 10⁵ control NIH3T3 cells or cells stably expressing SRSF1 or SRSF9 at the indicated days post injection. Each group contained eight mice. Error bars, s.d. The tumour weight (D) was measured when the mice were sacrificed on Day 19 (mean ± SD, n = 8, **p < 0.01). Tumours from each group are shown (E).

