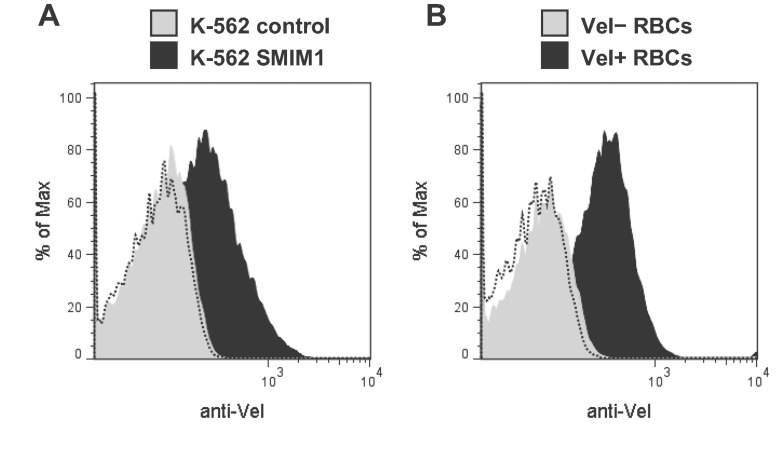
Figure 5.
Cell-surface expression of the Vel antigen in SMIM1-transfected K-562 cells compared with RBCs.
A. Flow cytometry analysis of native K-562 cells stably transfected with a SMIM1 expression construct (black profile) or with the corresponding empty vector (grey profile) that were labelled with an anti-Vel. The dashed profile corresponds to K-562 SMIM1 cells incubated with only the secondary antibody.
B. Flow cytometry analysis of native RBCs taken from a Vel+ subject (black profile) or a Vel− subject (grey profile) labelled with an anti-Vel. The dashed profile corresponds to Vel+ RBCs incubated with only the secondary antibody.

