Figure 2.
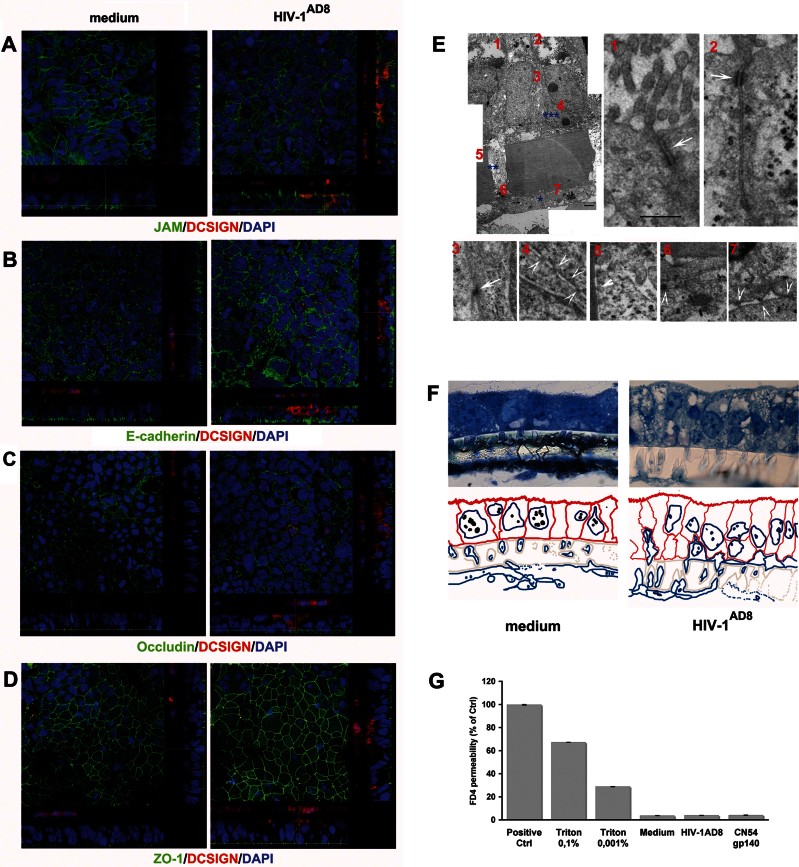
DCs migration does not alter junctional protein expression by Caco-2 cells and preserves the integrity of the HIV-1 treated monolayer.
The Caco-2/DCs co-culture system was incubated with medium or R5 HIV-1AD8 at 24 ng of p24 Ag for 1.5 h.
A–D. CM cross-sectional images of specimens stained for DCSIGN-PE (red) and for the epithelial junctions (green) JAM (A), E-Cadherin (B) Occludin (C) ZO-1 (D) showed that HIV-1 as well as migrated DCs did not affect the intraepithelial junctions expression in the Caco-2/DC system. DAPI stained the nuclei. Results are from one representative experiment out of three.
E. Ultrastructure of Caco-2/DCs culture treated with R5 HIV-1J6363 (at 1 ng of p24 Ag) for 1.5 h. TEM images show DCs adhering to the filter (*), DCs protrusions inside the filter membrane pore (**) and a DC interposed between adjacent Caco-2 cells (***) Scale bar: 2 µm. Numbers identify the corresponding magnified images displayed in panel (E), and arrows point to interepithelial TJs (1, 2), TJs-like structures between DCs and Caco-2 cells (3–5), contiguity among cells inside the pore (6), and junction like-structures between DCs (7) Scale bar: 500 nm. Results from a representative experiment out of three are shown.
F. Semi-thin sections for TEM labelled with Toluidine blue and the corresponding explicative colour mask below (Caco-2 cells red, DCs blue, filter grey) show the morphology and the spatial organization of cells. Caco-2 cells are columnar and polarized, displaying microvilli, dense cytoplasmic granules and vacuoles characteristic of epithelial cells. DCs are disposed along the lower face of the filter, inside the membrane pores and, in HIV-1 treated sample, intercalated in between Caco-2 cells, without destroying epithelial monolayer continuity.
G. The permeability of the Caco-2/DCs culture to FD4 (4 kDa, 250 µg/ml) in the presence of medium, R5 HIV-1AD8 (at 24 ng of p24 Ag) and CN54 gp140 protein (100 ng/ml) is shown as percentage of the positive control (i.e. FD4 added in the upper chamber of the transwell without Caco-2 cells). Triton X100 was included as control of barrier disruption. Results are mean values ± SD of triplicates from a representative experiment out of three.

