Figure 6.
DC migration across the epithelial monolayer in response to gp140 protein of different HIV-1 subtypes.
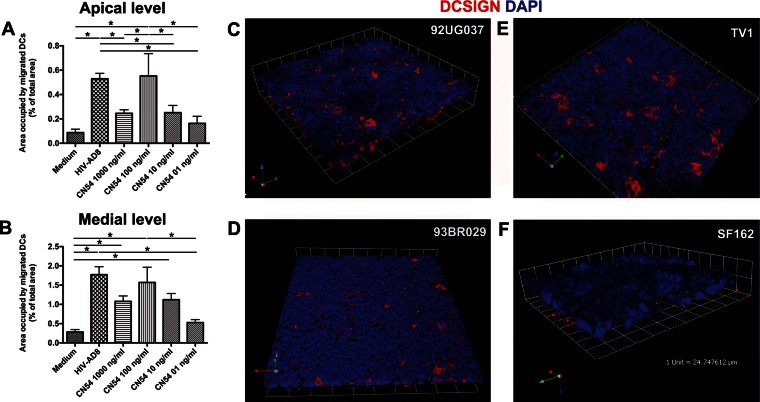
A,B. The monolayer of the Caco-2/DCs system was incubated for 1.5 h with decreasing dose of R5 CN54 gp140 trimeric protein. Medium and R5 HIV-1AD8 were used as negative and positive control, respectively. Bar charts represent quantitative analysis of DCs migration across the Caco-2 cell at the apical (A) and medial (B) level of the cell monolayer (as in Fig 1). Results are expressed as percentage of area occupied by DCs compared to that of the whole field. Bars represent mean ± SD of three different fields of three different experiments. *p < 0.05.
C–F. DC migration was induced with gp140 protein (100 ng/ml) of 92UG037 (C), 93BR029 (D), and TV1 (E) but not with that of SF162 (F). Representative three-dimensional renderings from CM z-series stacks of the Caco-2 and DCs on filter stained for DAPI (epithelial cells and DCs; blue) and mouse anti-human DC-SIGN-PE (DCs; red) are shown. Results are those from one representative experiment out of three.

