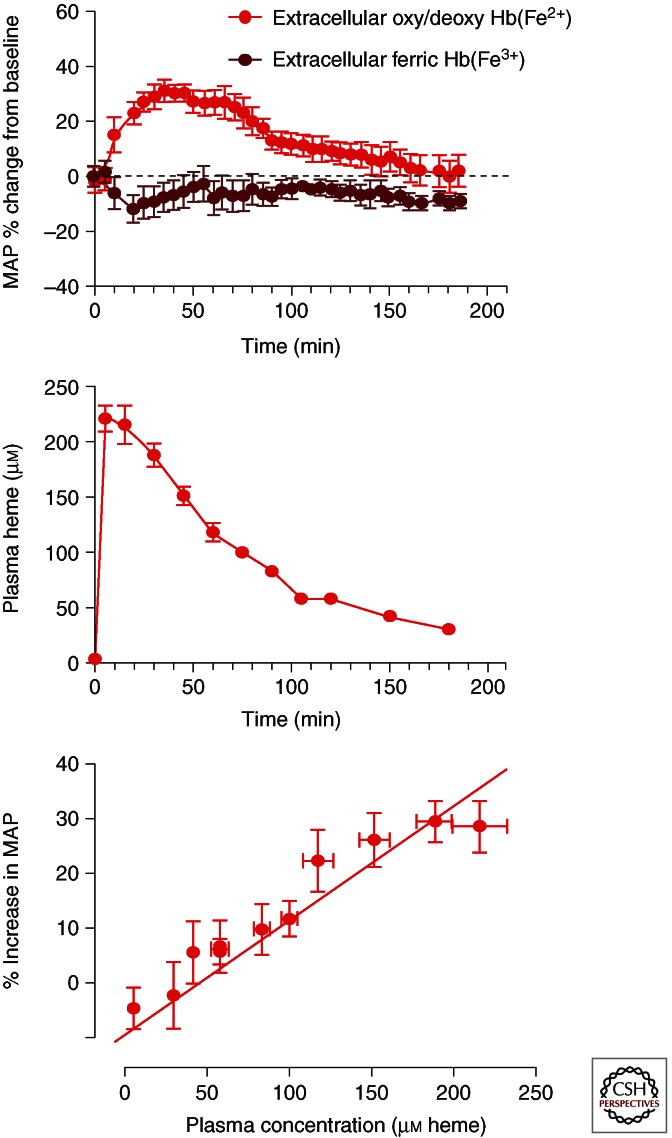
Figure 3.
Plasma concentration blood pressure relationships. (Top) The blood pressure response to ferrous (red) and ferric (brown) hemoglobin following a 20% top load to conscious guinea pigs. Ferric hemoglobin shows no response, whereas ferrous hemoglobin shows a rapid and transient increase in mean arterial pressure. This is consistent with the hemoglobin plasma concentration time course shown (middle). These two time effects can be better visualized by plotting plasma concentration versus percent mean arterial blood pressure change from baseline (bottom).

