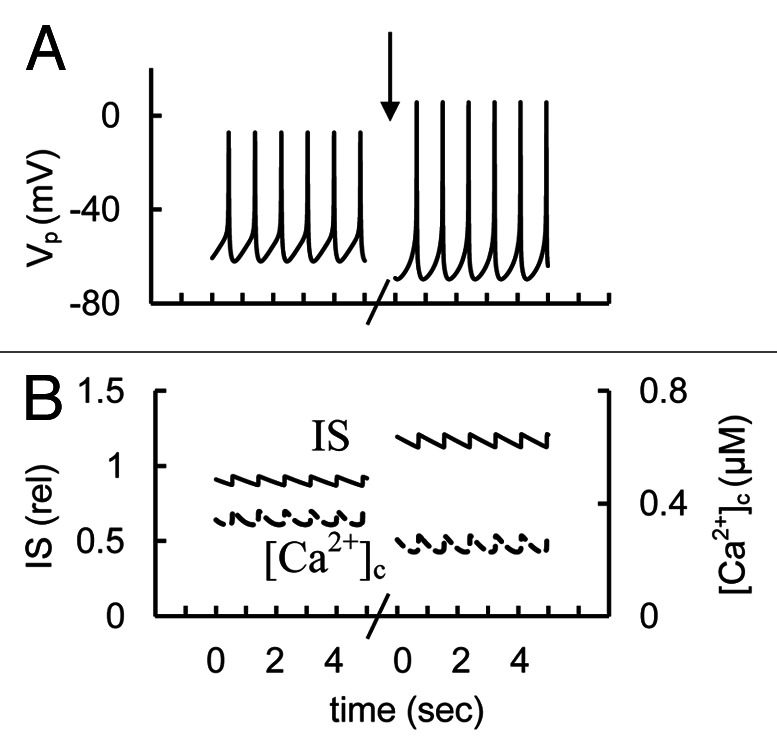
Figure 12. Simulated glucose induced AP firing, [Ca2+]c and relative IS at persistent (late) Na+ current changes. (A) AP firing (Vp); (B) [Ca2+]c (– – –) and relative IS (——). Initially the coefficient (kNar, Eq. A1, Appendix 2 in Supplemental Material) responsible for persistent Na+ current was 0.002 (basal level for this coefficient is zero in Table S2). For simulation of block of the persistent (late) Na+ currant this coefficient was decreased to 0.0006 at arrow. Glucose induced AP firing was simulated as in Figure 3. Five second intervals are represented.
