
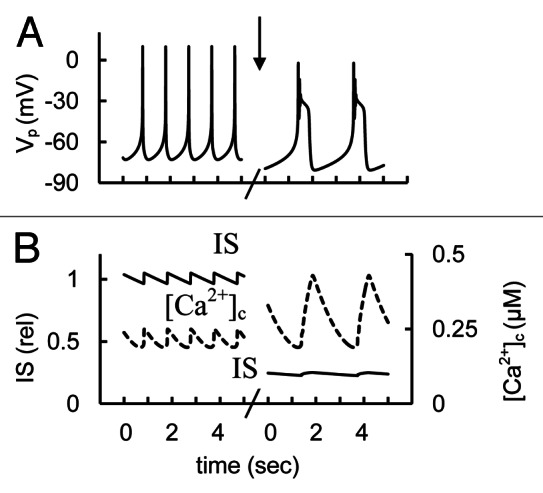
Figure 15. Simulated glucose induced AP spikes, [Ca2+]c and IS changes after of P-type Ca2+ channel blockers application. (A) AP firing (Vp); (B) [Ca2+]c (– – –) and relative IS (——). The maximal conductance (gmCaP, Eq. A14, Appendix 2) was decreased from 1.2 nS (basal level from Table S2) to 0.2 nS at arrow. Glucose induced AP firing was simulated as in Figure 3. Five second intervals are represented.