
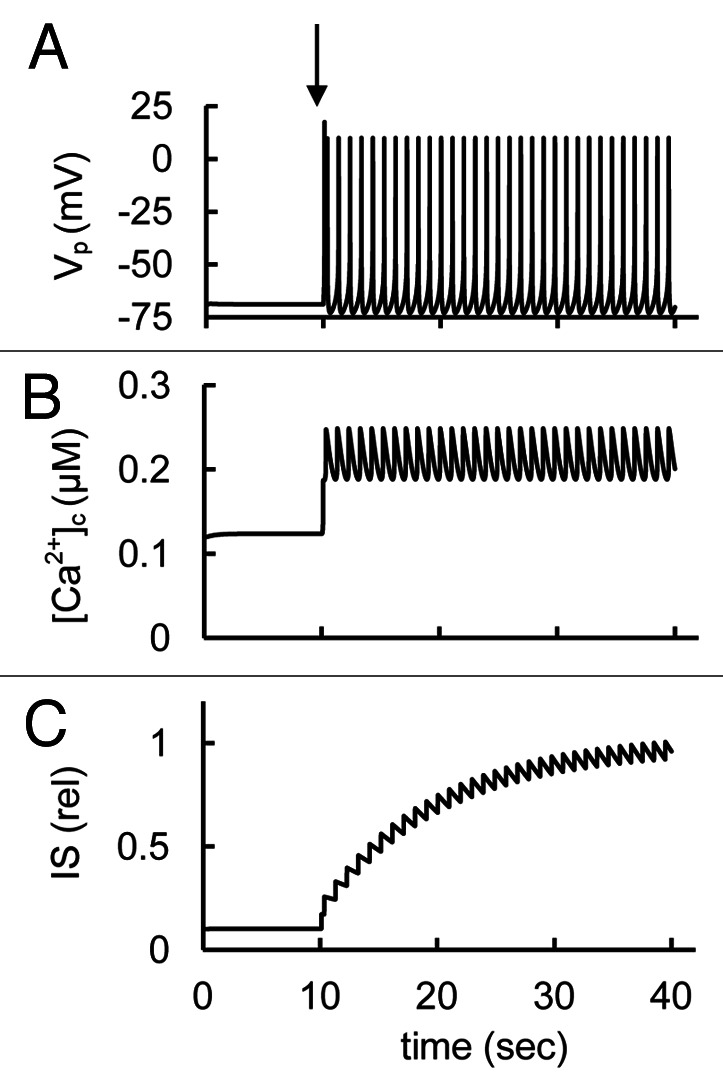
Figure 3. Modeling of spontaneous glucose-stimulated spikes, the changes of intracellular Ca2+ concentration and insulin secretion. (A) Action potentials (Vp); (B) Free cytoplasmic Ca2+ concentration ([Ca2+]c); (C) relative insulin secretion (IS). Glucose-induced spikes were simulated at a step decrease of the free ADP concentration at the arrow from a high to an intermediate value (from [ADPf]c = 100 µM to 15 µM; all other parameter were taken from the basal set of parameters (Tables S1 and S2). Corresponding changes in [Ca2+]c and IS were simulated using Eqs. Two and 7 in Appendix 1 in Supplemental Materials.