
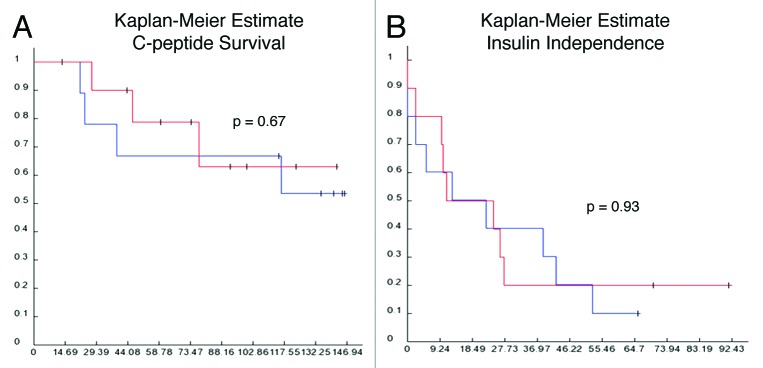
Figure 2. Graft survival. Kaplan-Meier curves for c-peptide survival (A) and insulin independence (B), where blue line = cases with steatosis and red line = controls without steatosis.
Official websites use .gov
A
.gov website belongs to an official
government organization in the United States.
Secure .gov websites use HTTPS
A lock (
) or https:// means you've safely
connected to the .gov website. Share sensitive
information only on official, secure websites.
Figure 2. Graft survival. Kaplan-Meier curves for c-peptide survival (A) and insulin independence (B), where blue line = cases with steatosis and red line = controls without steatosis.