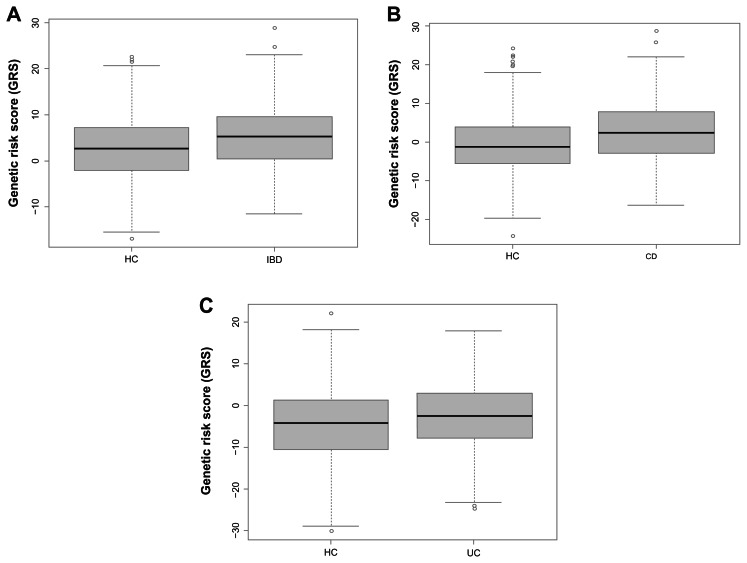
Figure 2.
Boxplots of genetic risk score analysis. Boxplots of IBD versus HC (A), CD versus HC (B), and UC versus HC (C).
Notes: GRS analysis is performed using 56 SNPs in RAC1/2, CYBA, NCF2, and NCF4 genes. SNPs are weighted based on the effect size (OR) from the univariate SNP association analysis by adjusting on gender.

