Figure 3.
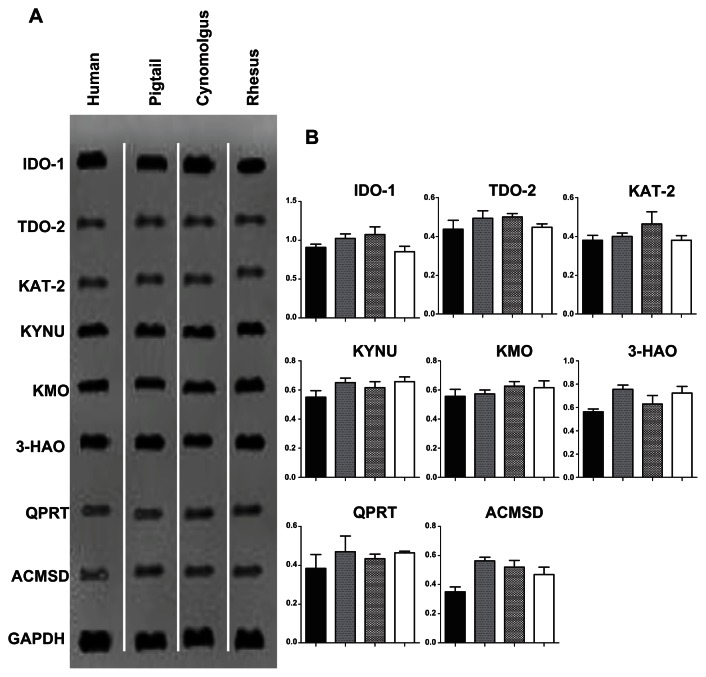
Expression of the kynurenine pathway enzymes using RT-PCR in macrophages stimulated with IFN-γ for 24 h. (A) Ethidium bromide-stained gels showing RT-PCR for IDO-1, TDO-2, KAT-2, KYNU, KMO, 3-HAO, QPRT, ACMSD and GAPDH expression (top to bottom). The first column corresponds to human macrophages, the second to pigtail macaque macrophages, the third to cynomolgus macaque macrophages and fourth to rhesus macaque macrophages. (B) The histograms indicate the ratio of the expression of the eight kynurenine pathway enzyme mRNA relative to the GAPDH mRNA expression. Each column of the histogram also corresponds to the columns in (A).
Note: Individual samples were analyzed in triplicate, and the SEM for all data was determined to be ±7%.

