Fig. 3.
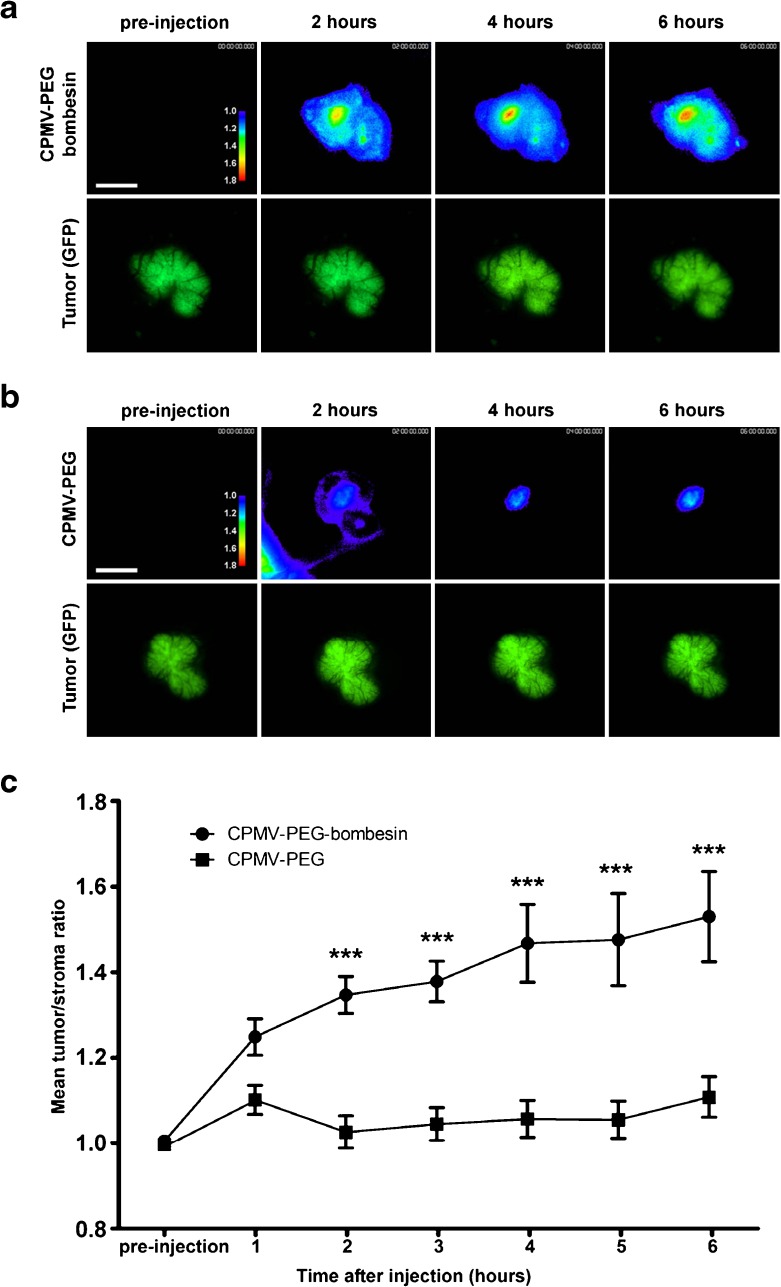
Intravital imaging of viral nanoparticle uptake in prostate tumors in vivo. a Intravital fluorescence confocal imaging of PC-3 prostate tumor (green channel) showing uptake of AF647-labeled CPMV-PEG-BOMB (heat map) over time. Images are representative of n = 10 experiments. Colors correspond to tumor/stroma ratio (see key). Scale bar = 3 mm. b Intravital imaging of PC-3 prostate tumor (green channel) showing uptake of AF647-labeled CPMV-PEG (heat map) over time. Images are representative of n = 10 experiments. Colors correspond to tumor/stroma ratio (see key). Scale bar = 3 mm. c Quantitation of tumor uptake of CPMV conjugates over time, n = 10 experiments per group. Values expressed as mean tumor/stroma ratio, using GFP channel to delineate tumor. Uptake of CPMV-PEG-BOMB is significantly higher than CPMV-PEG (P < 0.0001). Reproduced with permission from Steinmetz et al., Small 2011 [50]

