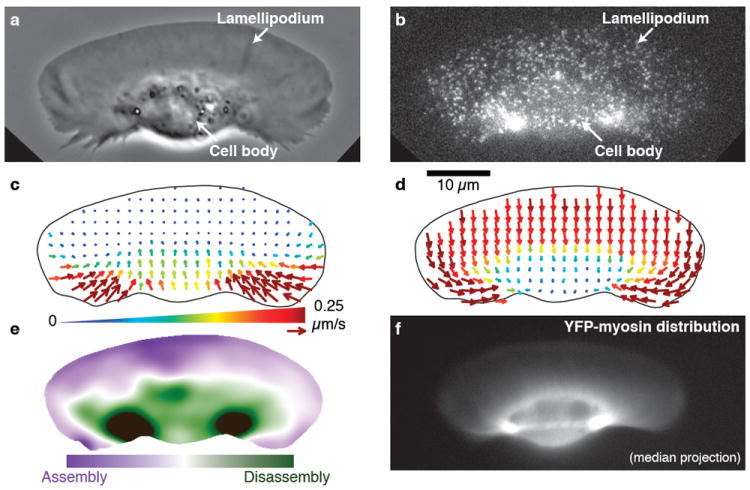
Figure 1. Myosin II in keratocytes colocalizes with the primary sites of actin network disassembly.

a–e, data and analysis of a single live keratocyte. a, Phase-contrast image of the keratocyte moving upward. b, Fluorescence speckle microscopy (FSM) image of the actin network labeled with a low concentration of phalloidin. c, F-actin flow field based on speckle tracking, in the laboratory frame of reference. Arrow length and color both indicate the speed of actin network flow. d, F-actin flow field in the cell frame of reference. e, Steady-state net F-actin assembly and disassembly. f, Fluorescence image of YFP-tagged myosin regulatory light chain in a keratocyte of similar size and shape to the one shown in a–e. Myosin II is found at low levels throughout the lamellipodium and at the highest concentrations in two foci flanking the cell body, which coincide with the primary sites of actin network disassembly as shown in e.
