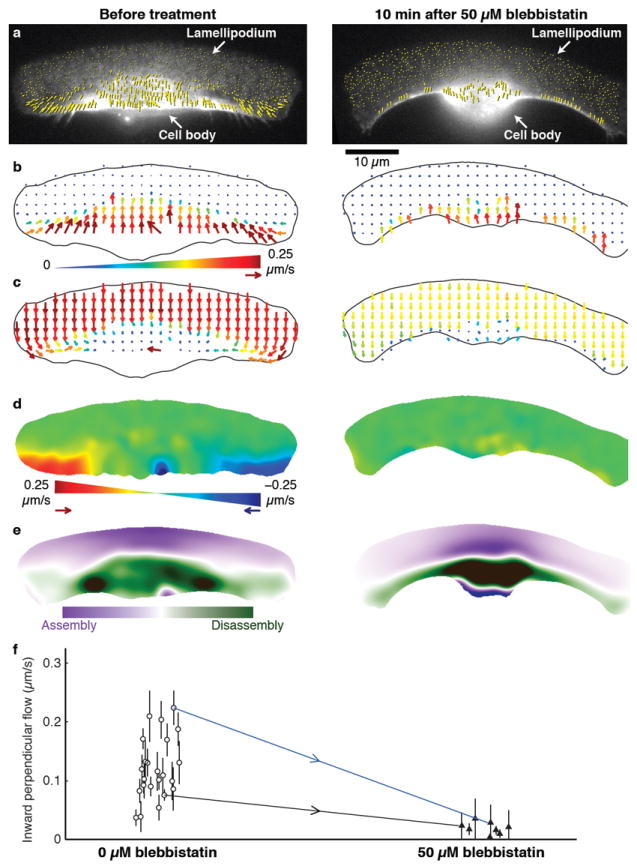
Figure 2. Inhibition of myosin II blocks inward flow and alters the pattern of disassembly of the actin network.

a–e, Analysis of actin network flow in a single keratocyte before (left) and ~10 min after (right) addition of 50 μM blebbistatin. a, Raw F-actin speckle flow measurements (yellow arrows) in the laboratory frame of reference, superimposed on the corresponding FSM frames. b, Resampled flow field in the laboratory frame of reference. c, Resampled flow field in the cell frame of reference. d, Maps showing the component of network flow perpendicular to the direction of cell movement (“perpendicular flow”), in the cell frame of reference. Red indicates F-actin flow toward the right; blue, toward the left. Actin network movement in the green regions is parallel to the direction of cell locomotion. Blebbistatin treatment abolishes inward flow. e, Steady-state assembly/disassembly maps. Before blebbistatin treatment, the highest rate of disassembly is found in two foci flanking the cell body. After blebbistatin treatment, disassembly is distributed along the rear margin. f, Inward perpendicular flow of the actin network in untreated (white circles; n = 23) and blebbistatin-treated (black triangles; n = 8) cells. Error bars indicate average ± s.d. over each movie (typically 4 min). Measurements were made both before and after treatment for two of the cells; blue and black arrows connect the corresponding data points. The data points connected by the blue arrow correspond to the cell shown in a–e. Compare Supplementary Movie 1.
