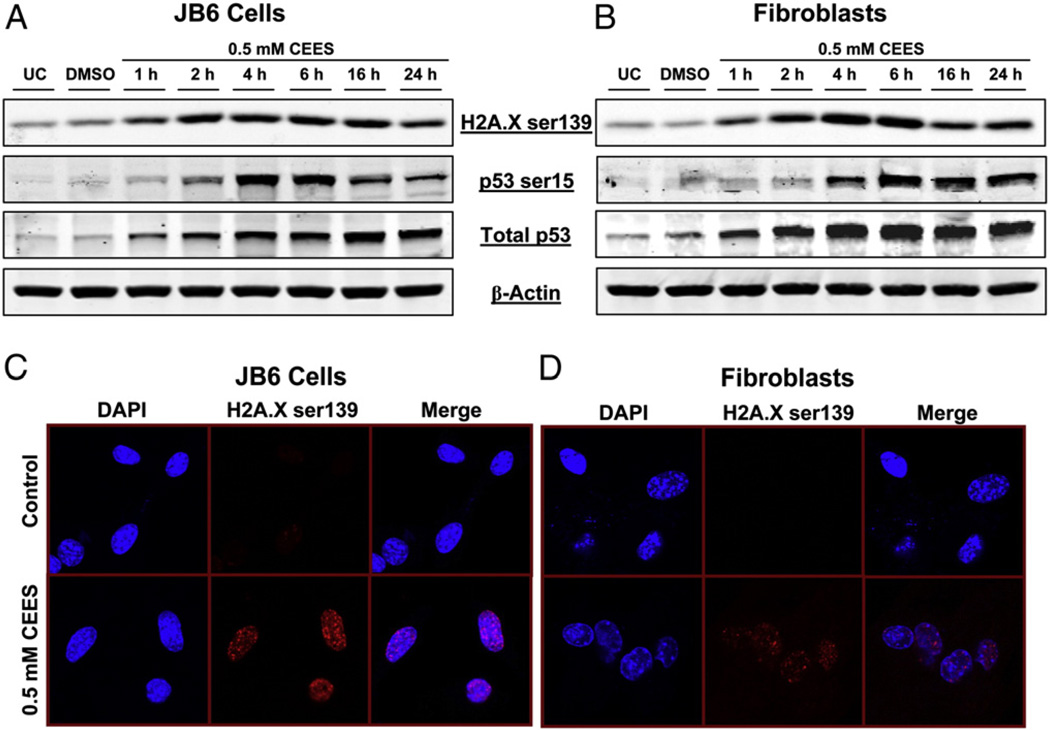
Fig. 1.
Effects of CEES exposure on the phosphorylation of H2A.X at Ser139 and p53 at Ser15 in JB6 cells and fibroblasts. (A) JB6 cells and (B) fibroblasts were exposed to DMSO or 0.5 mM CEES and collected at various time points starting within 1 h of CEES exposure. Whole-cell lysates were prepared and subjected to SDS–PAGE followed by Western blot analysis for H2A.X Ser139 and p53 Ser15 using 80 µg protein as detailed under Materials and methods. Total p53 protein levels and β-actin levels were determined by stripping and reprobing the membranes with total p53 and β-actin antibodies. (C and D) 4 h after similar treatments, both cell types were subjected to immunofluorescence to assess the phosphorylation of H2A.X Ser139, which were seen as foci formation in the nucleus (stained using DAPI). Cell images were captured at 400× original magnification on a Nikon D Eclipse C1 confocal microscope as described under Materials and methods. UC, untreated control; DMSO, vehicle control.

