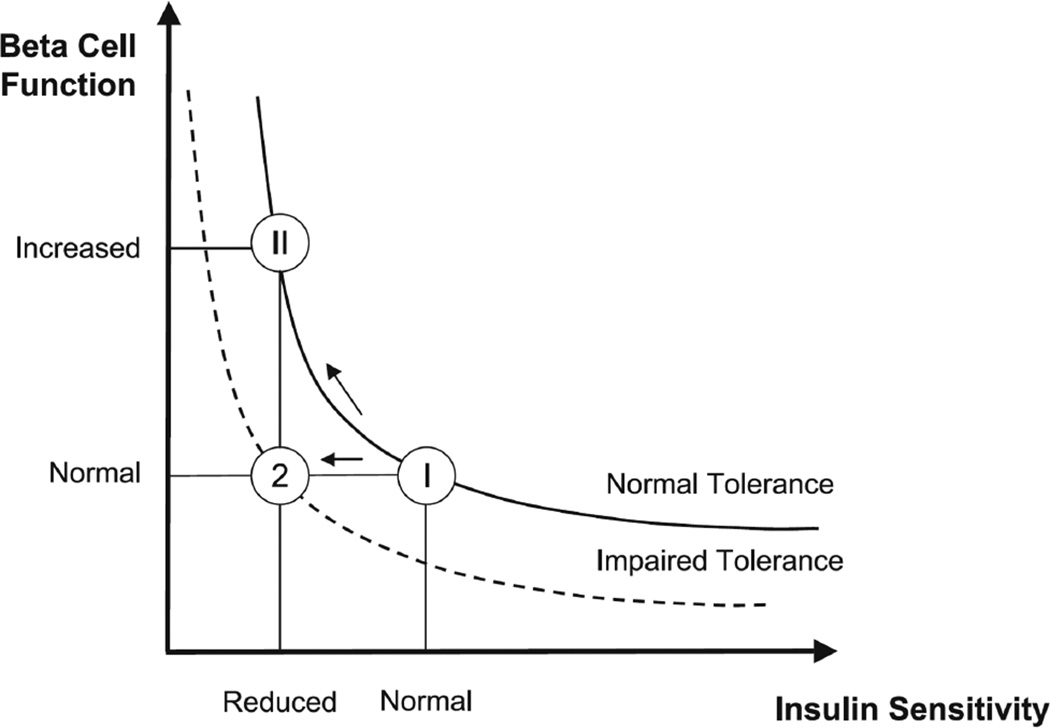
Figure 3.
Different hyperbolas representing the disposition index: a normal subject reacts to impaired insulin sensitivity by increasing β-cell responsivity (state II), whereas a subject with impaired tolerance does not (state 2). In state II, β-cell responsivity is increased, but the disposition index β-cell metric is normal; whereas in state 2, β-cell responsivity is normal, but the disposition index is impaired [38].

