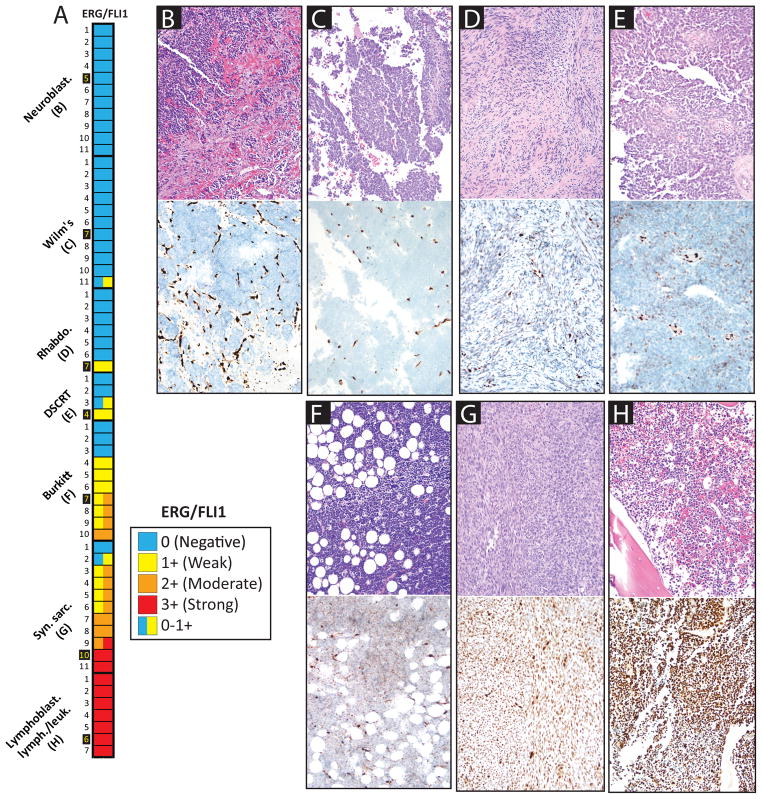
Figure 3. ERG/FLI1 staining in small round blue cell tumor (SRBCT) mimickers of Ewing family tumors (EFTs).
Heat map of ERG/FLI1 staining (nuclear) in 61 non-EFT SRBCTs., ERG/FLI1 staining was scored as in Figures 1 & 2. In cases with heterogeneous staining, the variable intensity is indicated by multiple colors in the heat map cell. Cases shown are indicated by yellow names. B–H. Hematoxylin and eosin (H&E, top panels) and ERG/FLI1 (bottom panels) staining for representative cases are shown (20x original magnification).

