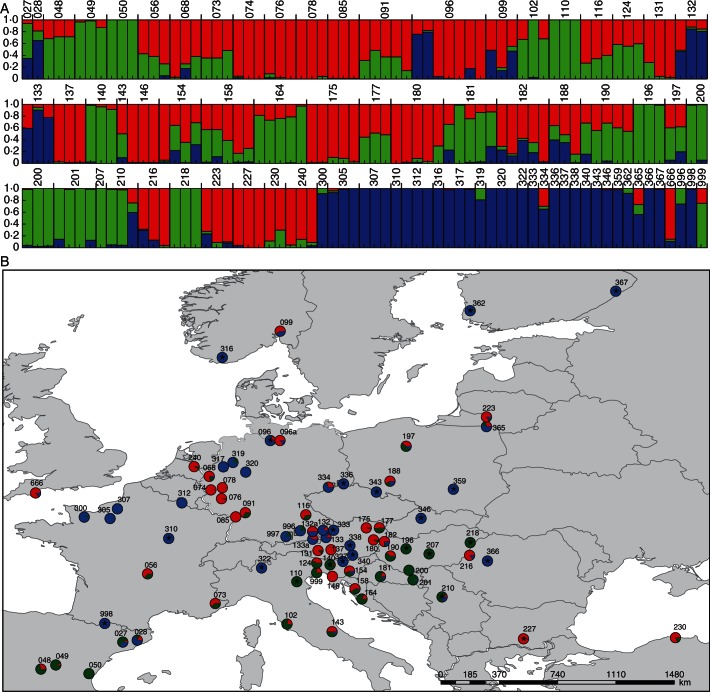
Fig. 3.
(A) Structure analysis of the AFLP data of single individuals (optimal K = 3; n = 195). The population code is given above the bars. The colour code corresponds to the plastid DNA data and distinguishes between Hypericum maculatum and two groups within H. perforatum (blue = H. maculatum; red and green = H. perforatum; Fig. 1). (B) Distribution map of populations. Pie charts combine the data from the individuals on the populational level. Asterisks (*) indicate diploid populations. Colour code follows (A) and Fig. 1 (blue = H. maculatum; red and green = H. perforatum). Additional populations analysed for morphometrics are shown in Supplementary Data Fig. S1.

