
Fig. 1.
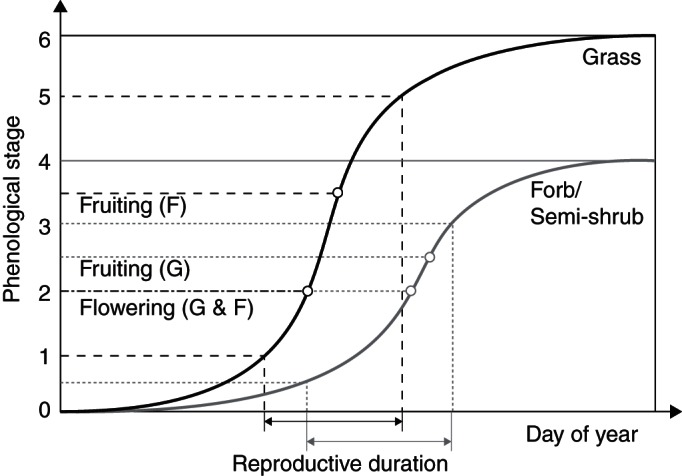
Ideal curves of phenological stage changes for graminoids (G; grey lines) and forbs and semi-shrubs (F; black lines). Parameters (K, a, b, X and m) describing the shape of the curve were obtained by fitting the observed phenological scores to eqn (1) for each species in each growing season. Details of the methods are provided in the text.