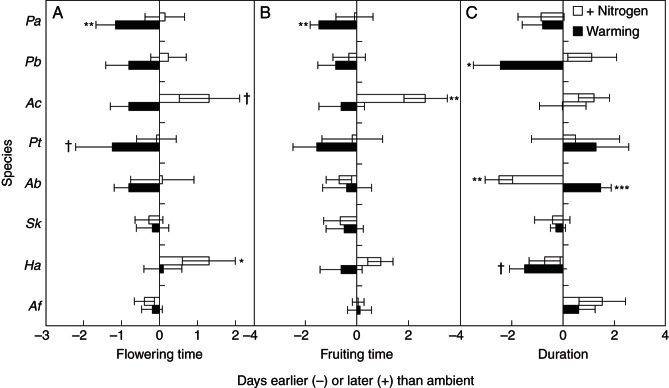
Fig. 4.
Changes in (A) flowering time, (B) fruiting time and (C) phenological duration (in days) under nitrogen addition and warming. Species are listed in order of mean time of buds first observed in control plots over the four growing seasons, beginning in April with P. acaulis and ending in October with A. frigida. Data are the mean ± s.e. for advanced (–) or delayed (+) phenology. For species' abbreviations see Table 1. †P < 0·1; *P < 0·05; **P < 0·01.

