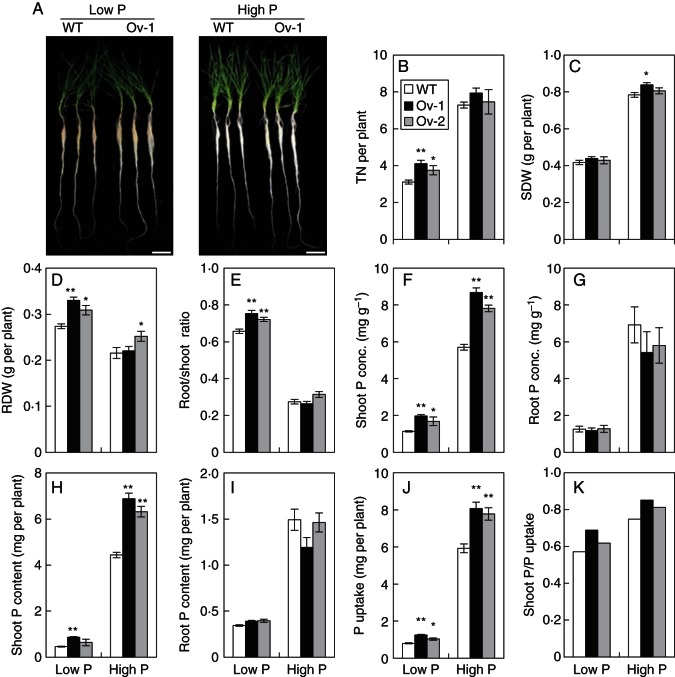
Fig. 6.
Growth performance and P uptake of the wild type and the transgenic lines grown in hydroponic culture. Seeds were germinated for 7 d, and then the germinated seeds with residual endosperm removed were transferred to nutrient solution containing 10 µm Pi (low P) and 200 µM Pi (high P), respectively. After the plants were grown in the low and high P nutrient solutions for 21 d, the shoots and roots were collected separately for further analysis. Data were the mean ± s.e. of four replications. * and ** indicate that the difference between the means of the wild type and the transgenic line was significant at P < 0·05 and P < 0·01, respectively. (A) The shoot and root phenotypes of the wild type and the transgenic line Ov-1 under low and high P conditions. (B) TN, tiller number. (C) SDW, shoot dry weight. (D) RDW, root dry weight. (E) Root/shoot dry weight ratio. (F) Shoot P conc., shoot total P concentration. (G) Root P conc., root total P concentration. (H) Shoot P content, total P accumulated in the shoot. (I) Root P content, total P accumulated in the root. (J) P uptake, total P accumulated in the root and shoot. (K) Shoot P/P uptake, ratio of shoot P content over P uptake.

