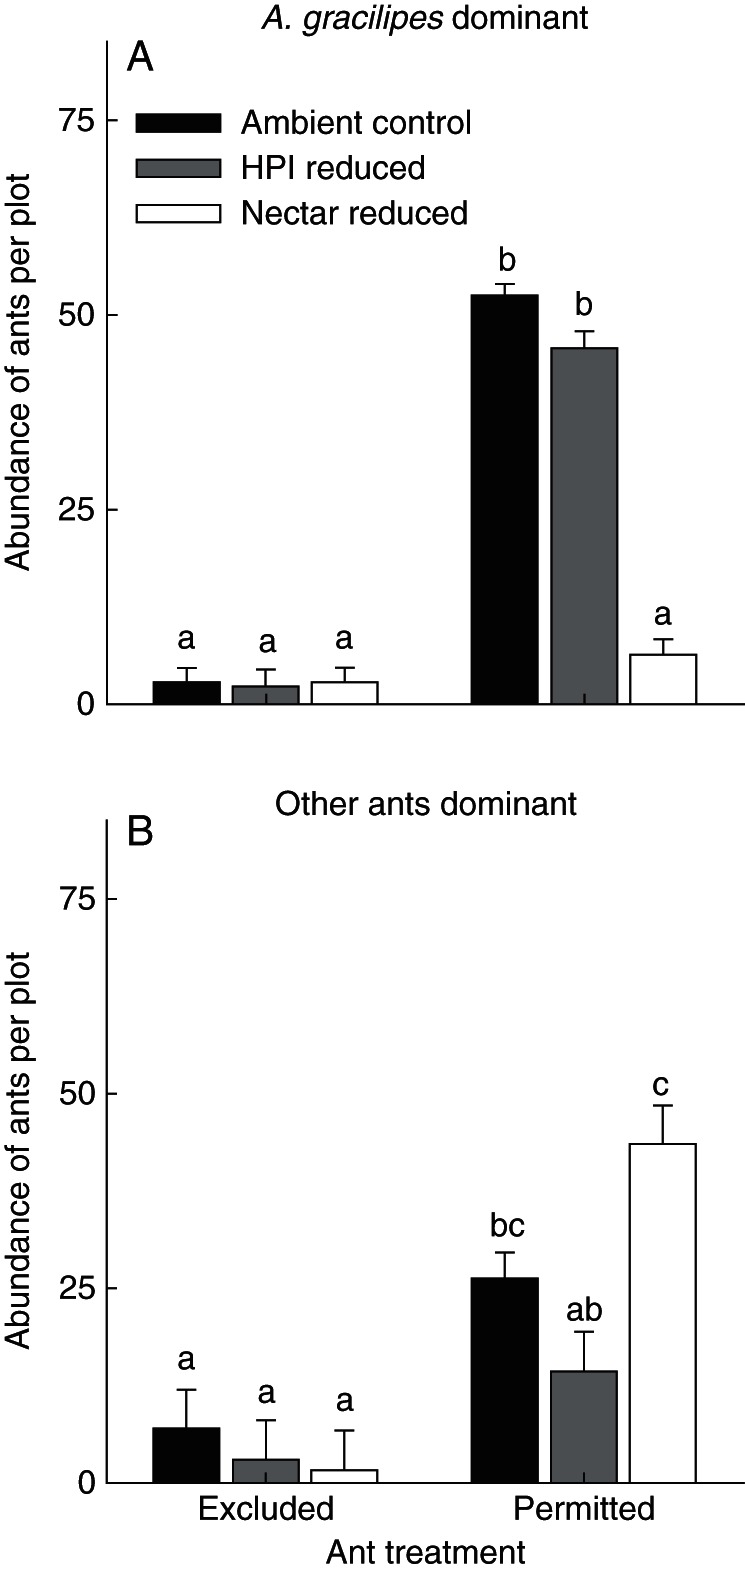
Fig. 3.

Plot (4 × 4 m)-level abundance of (A) A. gracilipes at invaded sites and (B) other dominant ants at control sites across our manipulations of access to M. citrifolia plants and availability of nectar and honeydew-producing insects (HPI). Bars represent the least square mean (LSM) + s.e. Different letters represent statistically different LSMs (P < 0·05; Tukey HSD). Sites dominated by A. gracilipes were analysed separately from sites dominated by other species.
