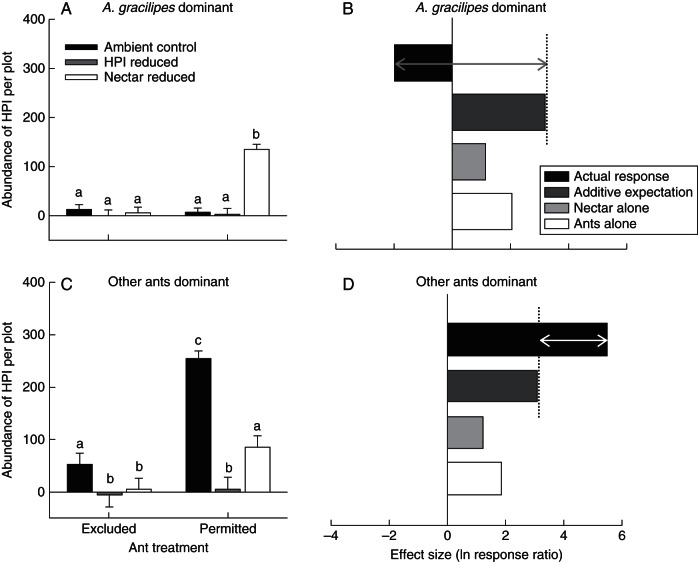
Fig. 4.
Influences of ants and M. citrifolia nectar on the abundance of HPI (A) at sites dominated by A. gracilipes and (C) at sites dominated by less invasive ant species. Bars represent the least square mean (LSM) + s.e. of raw data. Different letters represent statistically different log-transformed LSMs (P < 0·05; Tukey HSD). Sites dominated by A. gracilipes were analysed separately from sites dominated by other species. Graphs (B) and (D) depict the effect sizes (ln response ratios) of ants, nectar and their interaction on the abundance of HPI per plant at sites dominated by A. gracilipes and sites dominated by less invasive ant species, respectively. In these graphs, dark grey bars represent the expected additive effects of ants and nectar on HPI abundances (i.e. sum of ants alone and nectar alone) and black bars represent the realized additive + non-additive effects arising from the interaction between ants and nectar on HPI abundances per M. citrifolia plant.

