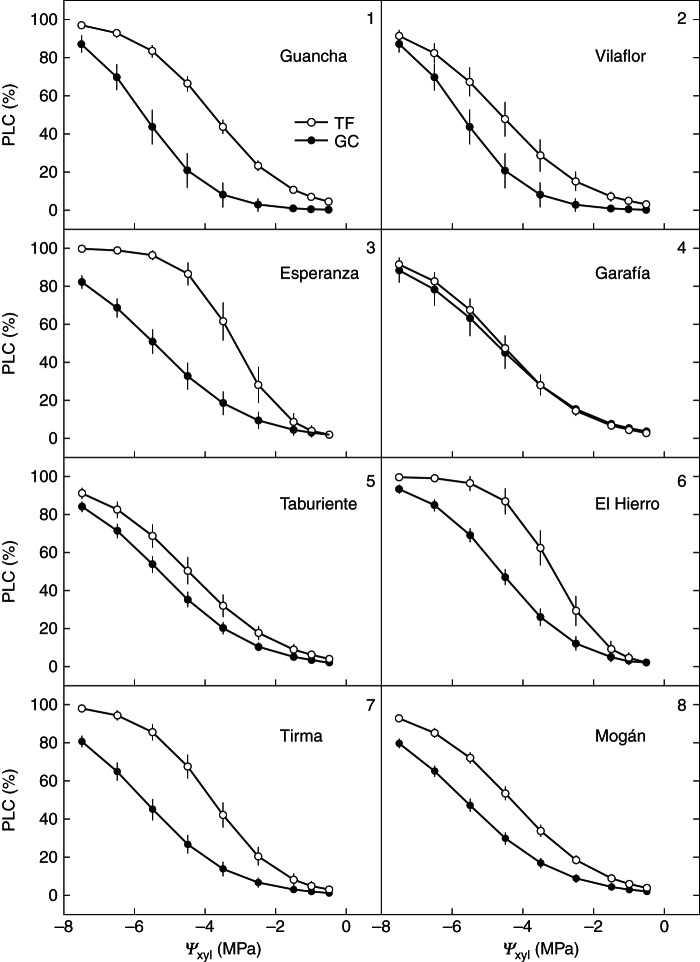
Fig. 2.
Xylem vulnerability curves for shoots of Pinus canariensis from populations of the eight ecological regions described for the species (numbered in the graphs) planted in two common gardens (TF, Tenerife; GC, Gran Canaria). Error bars represent the s.e. Ψxyl, xylem water potential; PLC, percentage loss of conductance.

