Fig. 6.

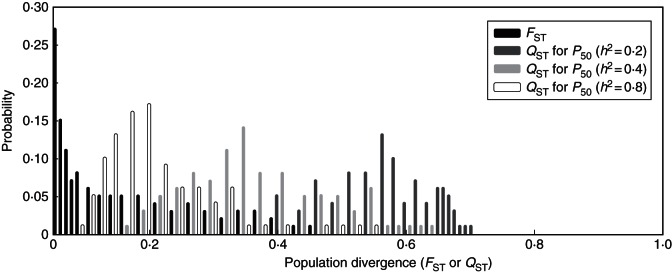
Frequency distributions of the cad gene (FST) and quantitative trait for P50 (QST) differentiation based on 1000 bootstrap samples. Estimated QST considering different values of narrow-sense heritability (h2).

Frequency distributions of the cad gene (FST) and quantitative trait for P50 (QST) differentiation based on 1000 bootstrap samples. Estimated QST considering different values of narrow-sense heritability (h2).