Table 3.
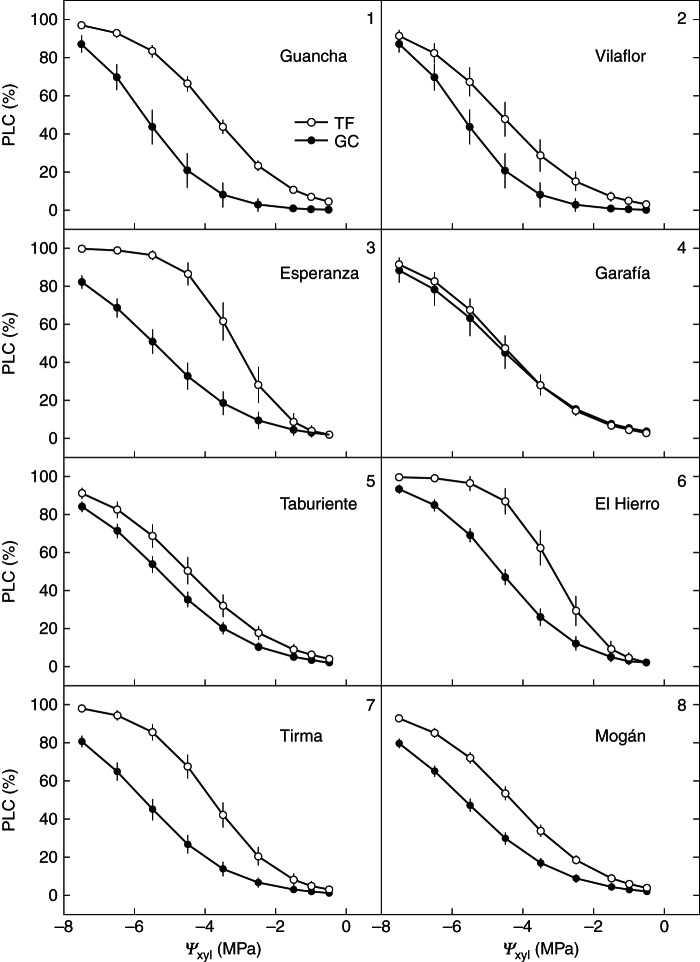
Percentage of the explained variation and significance values due to common garden, population and the interaction between common garden and population from the GLM and the GLZ for survival (Equation 6); coefficient of variation between (CVbp) and within (CVwp) populations, population differentiation for quantitative traits (QST) and log response ratio of the trait (L°*) for eight Pinus canariensis populations growing in two common gardens
| Trait | Com Gard | Pop | Com Gard × Pop | CVbp | CVwp | QST |  |
|---|---|---|---|---|---|---|---|
| Hydraulic efficiency | |||||||
| Ks | 15·33*** | 1·45 | 0 | 10·06 | 76·09 | 0·076 (0·10) | –0·42 (0·10) |
| Kl | 10·53*** | 3·58 | 1·28 | 20·72 | 79·11 | 0·089 (0·11) | 0·40 (0·16) |
| Vulnerability to cavitation | |||||||
| P12 | 34·35*** | 0 | 4·96 | 6·60 | 46·13 | 0·093 (0·08) | 0·48 (0·15) |
| P50 | 53·11*** | 5·48*** | 5·50* | 10·21 | 17·37 | 0·365 (0·09) | 0·31 (0·12) |
| P88 | 42·75*** | 9·00*** | 8·39** | 11·41 | 16·22 | 0·452 (0·08) | 0·25 (0·13) |
| Slope | 7·83*** | 5·80*** | 19·31** | 17·80 | 31·66 | 0·365 (0·09) | –0·16 (0·15) |
| Biomass allocation | |||||||
| Al:As | 40·26*** | 0·35 | 1·26 | 3·71 | 47·99 | 0·062 (0·09) | –0·61 (0·15) |
| Stem morphology | |||||||
| H | 94·12*** | 0·11 | 0 | 2·88 | 21·13 | 0·044 (0·09) | –0·92 (0·15) |
| Db | 59·96*** | 2·35 | 0 | 9·43 | 37·79 | 0·135 (0·09) | –0·72 (0·12) |
| Needle morphology | |||||||
| LMA | 73·16*** | 4·31* | 4·34* | 9·85 | 25·61 | 0·157 (0·09) | 0·35 (0·10) |
| Surv | 17·87*** | 4·80*** | 2·21 | ||||
The standard deviation is given in parentheses·
*P < 0·05; **P < 0·01; ***P < 0·001·
Ks, specific hydraulic conductivity; Kl, leaf specific hydraulic conductivity; P12, P50, P88, pressure causing 12, 50 and 88 % loss of conductance, respectively; slope, slope at the inflection point of the vulnerability curve; Al:As, branch leaf-to-sapwood area ratio; H, height 6 years after planting; Db, basal diameter 6 years after planting; LMA: leaf mass per area; Surv, survival.
