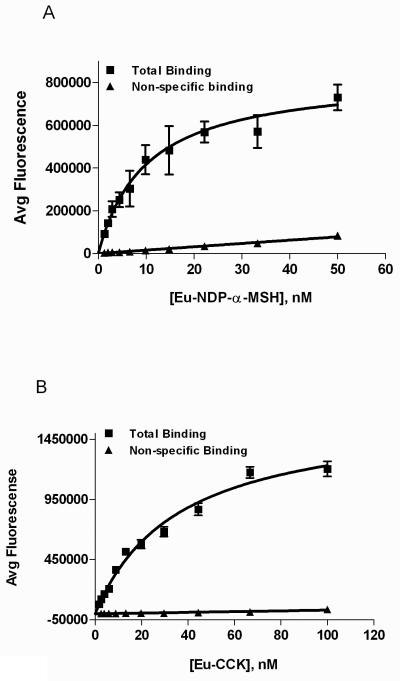
Figure 3. MC4R and CCK2R saturation binding and Scatchard plot analysis.
A. Saturation curve of Eu-NDP-α-MSH obtained from the MC4R and CCK2 dual expression cell line. The figure shows total binding (■) and binding in the presence of 10 μM NDP-α-MSH (▲). From these data, the Kd = 8.3 ± 1.9 nM, and Bmax = 732,000 ± 59,000 AFU. Lines represent the computer modeled best fit of the data using GraphPad Prism software using the non-linear regression, one site-binding equation, with a R2 value of 0.81. Each data point indicates the average of four samples, with error bars indicating the standard error mean. B. Saturation curve of Eu-CCK obtained from the MC4R and CCK2 dual expression cell line. The figure shows total binding (■) and binding in the presence of 1 μM CCK8 (▲). From these data, the Kd = 34.6 ± 3.9 nM, and Bmax = 1,600,000 ± 83,000 AFU, with a R2 value of 0.96.

