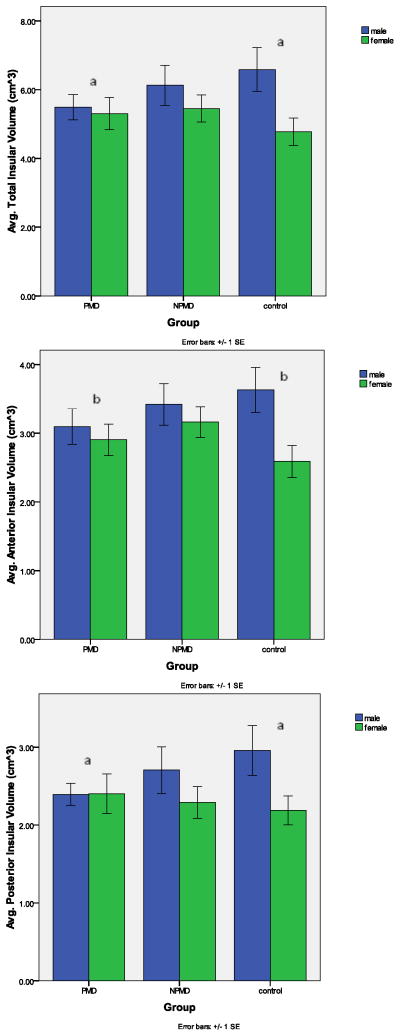
FIGURE 2. Gender Dependence of Insular Volume.
The graphs depict the mean hemispheric averaged insular volumes [(left + right hemisphere)/2] (cm3) for total, anterior and posterior insula adjusted for total brain volume and age, and organized by group. Men (blue) and women (green) are indicated by the different colors. Significant interaction between PMD and HC for total (ap-corrected <0.01), anterior (bp-corrected <0.05), and posterior (ap-corrected <0.01). The group-by-gender interaction was not significant for the total (p-corrected =0.867), anterior (p-corrected =0.997), or posterior (p-corrected =0.561) insula between the depressed groups. The group-by-gender interaction was not significant for the total insula (p-corrected=0.148), anterior (p-corrected = 0.059) or posterior insula (p-corrected =0.461) between the NPMD patients and controls.

