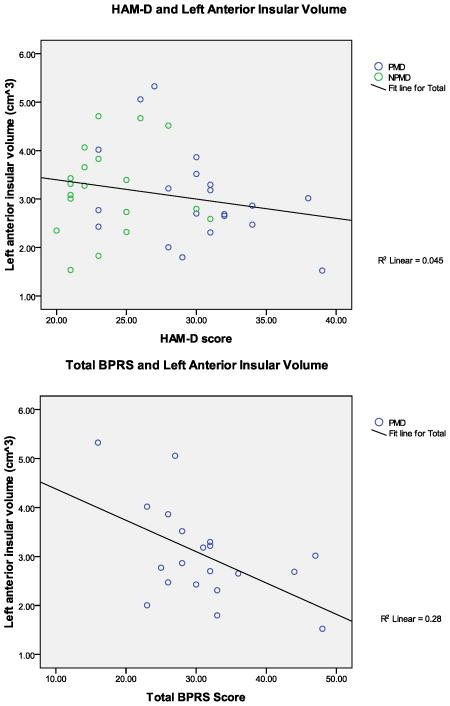
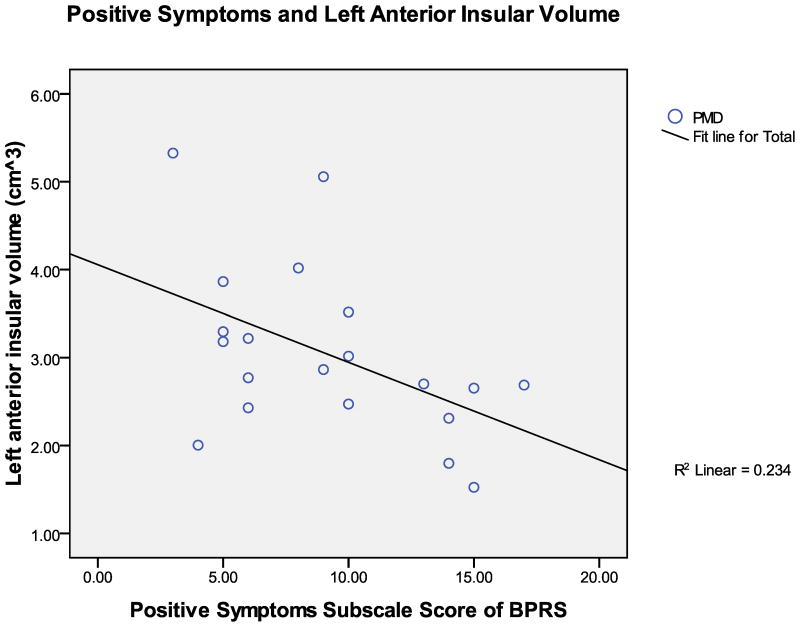
FIGURE 3. Correlation scatterplot of Psychotic Symptoms and Insular Volumes.
The graphs show scatterplots and trendlines for the relationships between left anterior insular volumes in cm3 (adjusted for total brain volume and age) and clinical measures of symptom severity (HAM-D, BPRS, positive symptom subscale of BPRS). The top graph shows HAM-D scores vs. left anterior insular volumes for all depressed patients (PMD + NPMD) since both groups show depressive symptoms. Correlations were also computed for PMD and NPMD groups separately, but graphical representations of those non-significant relationships were not shown here.


