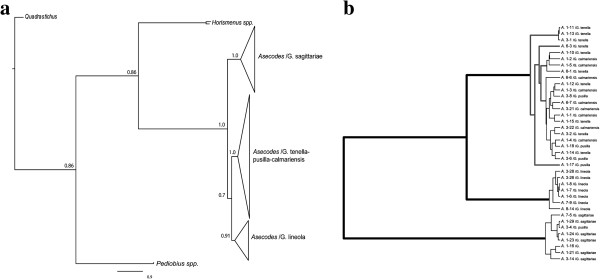
Figure 4.
Phylogram from Bayesian analysis of Asecode specimens. (a) Phylogram based on concatenated CO1, PGD, 28S and ITS sequences (3124 basepairs). Due to short branches and lack of structure within the three clades, they are visualized as triangles codes as “Asecodes /the Galerucella species which are parasitized”. The three clusters include 31 (“Asecodes/G. sagittariae”), 57 “Asecodes/G. tenella-pusilla-calmariensis” and 19 “Asecodes/G. lineola” individuals. (b) Result of the GMYC analysis on an ultrametric CO1 gene tree from BEAST. Splits of thick black branches indicate speciation events whereas splits of thin black branches indicate within-species coalescence events. Grey branches are ambiguous in the GMYC analysis and all solutions from 3 to 7 species are included in a +/− 0.5 Log likelihood confidence interval. The single coalescence one-species model is rejected in a likelihood ratio test p=0.011.

